
State of Sales
Third Edition
THIRD EDITION State of Sales Insights and trends from over 2,900 sales professionals worldwide
About This Report State of Sales 22 For the third edition of the “State of Sales” report, Salesforce Research surveyed over 2,900 global sales professionals and leaders to discover: • Which overall trends are changing the role of sales? • What challenges do sales teams face in the midst of these changes? • What are the current and future roles of new technologies like artificial intelligence (AI) as 1,154 they relate to the sales profession? Data in this report is from a blind survey 800 conducted from February 12 through March 15, 2018, that generated 2,908 responses from full-time sales professionals in the U.S., Canada, U.K./Ireland, France, Germany, the Netherlands, Japan, Australia/New Zealand, 954 Hong Kong, and Singapore. All respondents are third-party panelists (not limited to Salesforce customers). See page 55 for detailed respondent demographics. Due to rounding, not all percentage totals in this report equal 100%. All comparison calculations are made from total numbers (not rounded numbers). Salesforce Research provides data-driven insights to help businesses transform how they drive customer success. Browse all reports at salesforce.com/research. Salesforce Research
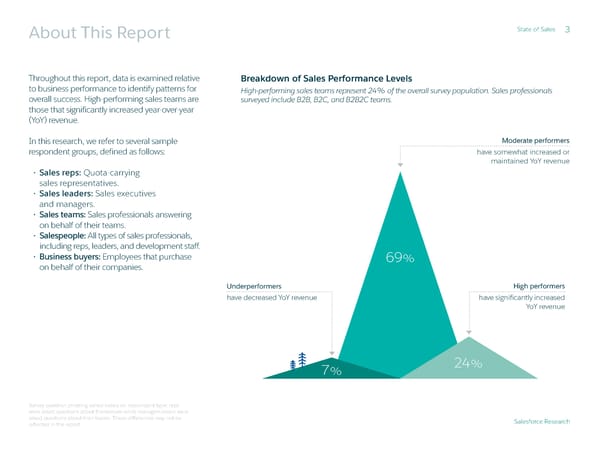
About This Report State of Sales 3 Throughout this report, data is examined relative Breakdown of Sales Performance Levels to business performance to identify patterns for High-performing sales teams represent 24% of the overall survey population. Sales professionals overall success. High-performing sales teams are surveyed include B2B, B2C, and B2B2C teams. those that significantly increased year-over-year (YoY) revenue. In this research, we refer to several sample Moderate performers respondent groups, defined as follows: have somewhat increased or maintained YoY revenue • Sales reps: Quota-carrying sales representatives. • Sales leaders: Sales executives and managers. • Sales teams: Sales professionals answering on behalf of their teams. • Salespeople: All types of sales professionals, including reps, leaders, and development staff. • Business buyers: Employees that purchase 69% on behalf of their companies. Underperformers High performers have decreased YoY revenue have significantly increased YoY revenue 7% 24% Survey question phrasing varied based on respondent type: reps were asked questions about themselves while managers/execs were asked questions about their teams. These differences may not be Salesforce Research reflected in the report.
Contents StaStatte oe of Salesf Sales 44 Executive Summary ..................................................................................................................................................... 5 01 Sales Teams Fall Short of Rising Customer Expectations ........................................................................... 6 A Data-Driven Sales Playbook Emerges ........................................................................................................ 11 02 The Impact of Artificial Intelligence Takes Shape ....................................................................................... 15 03 Virtual Selling Hits a Tipping Point ................................................................................................................. 20 04 Top Sales Teams Break from the Silo Mentality ........................................................................................... 23 05 Last Look: 4 Practices That Drive Sales and Customer Success ............................................................................. 27 Country Profiles ............................................................................................................................................................ 28 Industry Profiles ........................................................................................................................................................... 39 Appendix ........................................................................................................................................................................ 45 Survey Demographics ................................................................................................................................................. 55 Salesforce Research
Executive Summary StaStatte oe of Salesf Sales 55 Technology is pushing customer 01 Sales Teams Fall Short of Rising Customer Expectations expectations to all-time highs, (See page 6) and sales organizations into As customers expect more personalized, consultative engagement, salespeople bear the brunt of the change. uncharted territory. Accountable Increasingly responsible for emerging customer success, but also overwhelmed by tasks, reps report spending a for quotas — but also for customer mere one-third of their time selling. Fifty-seven percent of sales reps expect to miss their quotas this year. success — salespeople have far greater mandates than before. 02 A Data-Driven Sales Playbook Emerges (See page 11) How are sales organizations coping? Soft skills, such as ability to listen and demonstrate attention to detail, are still critical to winning deals, but teams New data-driven approaches to are increasingly bolstering ingenuity with data-driven insights. In the process, traditional approaches to lead sales, increasingly underpinned by prioritization and forecasting are falling by the wayside. Twice as many teams primarily prioritize leads based on AI, are emerging in tandem with data analysis of propensity to buy than on intuition. big changes spanning customer engagement, staffing models, and 03 The Impact of Artificial Intelligence Takes Shape cross-functional collaboration. (See page 15) This report takes a closer look at Sales teams’ use of AI is nascent, but the majority of teams expect it will gain ground quickly for a variety of use cases. Despite industry rumblings that AI will displace sales jobs, those using AI continue to expand their teams. how the world of sales is changing. Sales leaders expect AI adoption to grow by 155% by 2020. Here’s an overview of our top research findings. Virtual Selling Hits a Tipping Point 04 (See page 20) As the pace of business accelerates and customers rely less on in-person meetings, reps are spending more time in front of a screen — and staffing models are pivoting toward inside roles. Time spent connecting virtually with customers has increased 3.2x more than time meeting customers in person. 05 Top Sales Teams Break from the Silo Mentality (See page 23) As customers demand more contextualization and personalization across their entire buying journeys, sales teams are taking a collaborative approach. To enable this, teams are embracing a free and open internal flow of customer data. Eighty-one percent of teams say a connected view of data across the customer journey is important. Salesforce Research
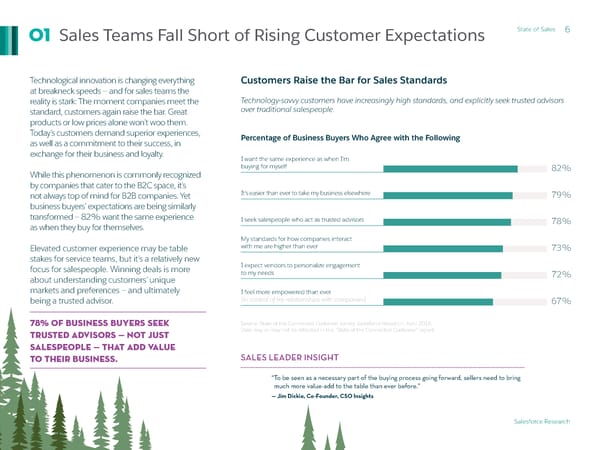
Sales Teams Fall Short of Rising Customer Expectations State of Sales 6 01 Technological innovation is changing everything Customers Raise the Bar for Sales Standards at breakneck speeds — and for sales teams the reality is stark: The moment companies meet the Technology-savvy customers have increasingly high standards, and explicitly seek trusted advisors standard, customers again raise the bar. Great over traditional salespeople. products or low prices alone won’t woo them. Today’s customers demand superior experiences, Percentage of Business Buyers Who Agree with the Following as well as a commitment to their success, in exchange for their business and loyalty. I want the same experience as when I’m buying for myself 82% While this phenomenon is commonly recognized by companies that cater to the B2C space, it’s not always top of mind for B2B companies. Yet It’s easier than ever to take my business elsewhere 79% business buyers’ expectations are being similarly transformed — 82% want the same experience I seek salespeople who act as trusted advisors 78% as when they buy for themselves. My standards for how companies interact Elevated customer experience may be table with me are higher than ever 73% stakes for service teams, but it’s a relatively new focus for salespeople. Winning deals is more I expect vendors to personalize engagement about understanding customers’ unique to my needs 72% markets and preferences — and ultimately I feel more empowered than ever being a trusted advisor. (in control of my relationships with companies) 67% 78% of business buyers seek Source: State of the Connected Customer survey, Salesforce Research, April 2018. trusted advisors — not just Data may or may not be reflected in the “State of the Connected Customer” report. salespeople — that add value to their business. SALES LEADER INSIGHT “To be seen as a necessary part of the buying process going forward, sellers need to bring much more value-add to the table than ever before.” — Jim Dickie, Co-Founder, CSO Insights Salesforce Research
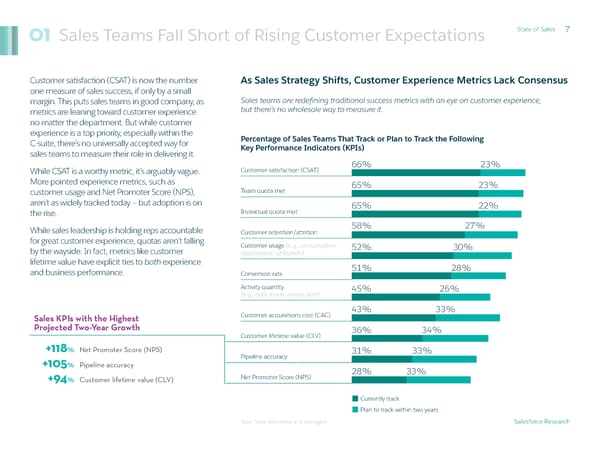
Sales Teams Fall Short of Rising Customer Expectations State of Sales 7 01 Customer satisfaction (CSAT) is now the number As Sales Strategy Shifts, Customer Experience Metrics Lack Consensus one measure of sales success, if only by a small margin. This puts sales teams in good company, as Sales teams are redefining traditional success metrics with an eye on customer experience, metrics are leaning toward customer experience but there’s no wholesale way to measure it. no matter the department. But while customer experience is a top priority, especially within the Percentage of Sales Teams That Track or Plan to Track the Following C-suite, there’s no universally accepted way for Key Performance Indicators (KPIs) sales teams to measure their role in delivering it. While CSAT is a worthy metric, it’s arguably vague. Customer satisfaction (CSAT) 66% 23% More pointed experience metrics, such as 65% 23% customer usage and Net Promoter Score (NPS), Team quota met aren’t as widely tracked today — but adoption is on 65% 22% the rise. Individual quota met While sales leadership is holding reps accountable 58% 27% Customer retention/attrition for great customer experience, quotas aren’t falling Customer usage (e.g., consumption, 52% 30% by the wayside. In fact, metrics like customer deployment, utilization) lifetime value have explicit ties to both experience 51% 28% and business performance. Conversion rate Activity quantity 45% 26% (e.g., calls made, emails sent) Customer acquisitions cost (CAC) 43% 33% Sales KPIs with the Highest Projected Two-Year Growth 36% 34% Customer lifetime value (CLV) +118% Net Promoter Score (NPS) 31% 33% +105% Pipeline accuracy Pipeline accuracy +94% Customer lifetime value (CLV) Net Promoter Score (NPS) 28% 33% Currently track Plan to track within two years Base: Sales executives and managers Salesforce Research
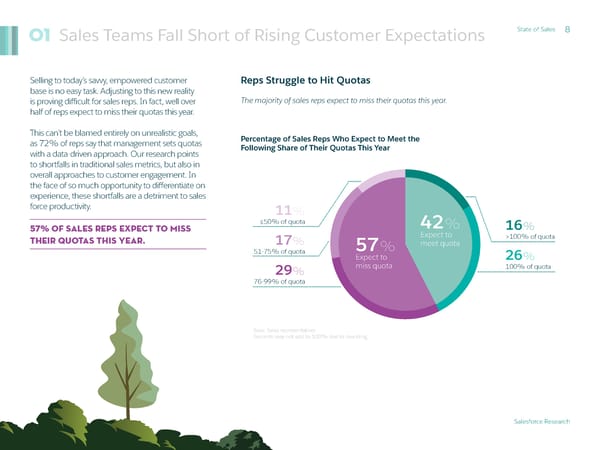
Sales Teams Fall Short of Rising Customer Expectations State of Sales 8 01 Selling to today’s savvy, empowered customer Reps Struggle to Hit Quotas base is no easy task. Adjusting to this new reality is proving difficult for sales reps. In fact, well over The majority of sales reps expect to miss their quotas this year. half of reps expect to miss their quotas this year. This can’t be blamed entirely on unrealistic goals, Percentage of Sales Reps Who Expect to Meet the as 72% of reps say that management sets quotas Following Share of Their Quotas This Year with a data-driven approach. Our research points to shortfalls in traditional sales metrics, but also in overall approaches to customer engagement. In the face of so much opportunity to differentiate on experience, these shortfalls are a detriment to sales force productivity. 11% 57% of sales reps expect to miss ≤50% of quota 42% 16% their quotas this year. 17% Expect to >100% of quota 57% meet quota 51-75% of quota Expect to 26% 29% miss quota 100% of quota 76-99% of quota Base: Sales representatives Percents may not add to 100% due to rounding. Salesforce Research
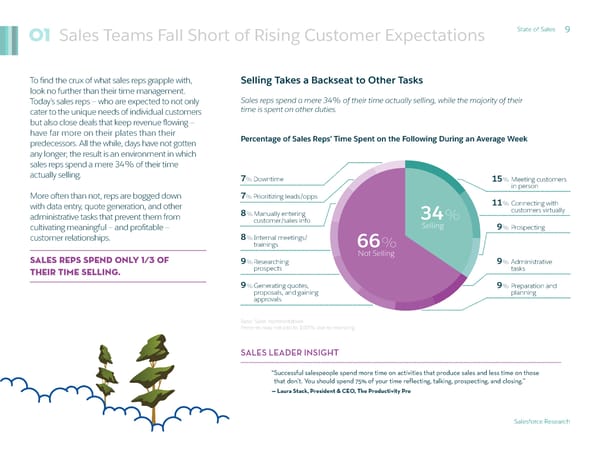
Sales Teams Fall Short of Rising Customer Expectations State of Sales 9 01 To find the crux of what sales reps grapple with, Selling Takes a Backseat to Other Tasks look no further than their time management. Today’s sales reps — who are expected to not only Sales reps spend a mere 34% of their time actually selling, while the majority of their cater to the unique needs of individual customers time is spent on other duties. but also close deals that keep revenue flowing — have far more on their plates than their Percentage of Sales Reps’ Time Spent on the Following During an Average Week predecessors. All the while, days have not gotten any longer; the result is an environment in which sales reps spend a mere 34% of their time actually selling. 7% Downtime 15% Meeting customers in person More often than not, reps are bogged down 7% Prioritizing leads/opps 11% Connecting with with data entry, quote generation, and other 8% Manually entering 34% customers virtually administrative tasks that prevent them from customer/sales info cultivating meaningful — and profitable — Selling 9% Prospecting customer relationships. 8% Internal meetings/ trainings 66% Sales reps spend only 1⁄3 of Not Selling 9% Researching 9% Administrative their time selling. prospects tasks 9% Generating quotes, 9% Preparation and proposals, and gaining planning approvals Base: Sales representatives Percents may not add to 100% due to rounding. SALES LEADER INSIGHT “Successful salespeople spend more time on activities that produce sales and less time on those that don’t. You should spend 75% of your time reflecting, talking, prospecting, and closing.” — Laura Stack, President & CEO, The Productivity Pro Salesforce Research
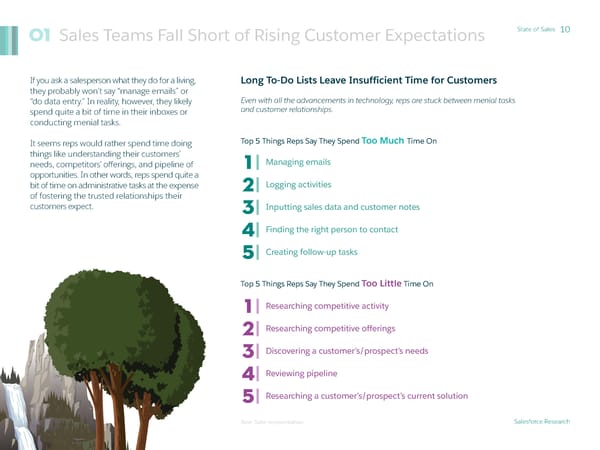
Sales Teams Fall Short of Rising Customer Expectations State of Sales 10 01 If you ask a salesperson what they do for a living, Long To-Do Lists Leave Insufficient Time for Customers they probably won’t say “manage emails” or “do data entry.” In reality, however, they likely Even with all the advancements in technology, reps are stuck between menial tasks spend quite a bit of time in their inboxes or and customer relationships. conducting menial tasks. It seems reps would rather spend time doing Top 5 Things Reps Say They Spend Too Much Time On things like understanding their customers’ needs, competitors’ offerings, and pipeline of 1 Managing emails opportunities. In other words, reps spend quite a bit of time on administrative tasks at the expense 2 Logging activities of fostering the trusted relationships their customers expect. 3 Inputting sales data and customer notes 4 Finding the right person to contact 5 Creating follow-up tasks Too Little Time On Top 5 Things Reps Say They Spend 1 Researching competitive activity 2 Researching competitive offerings 3 Discovering a customer’s/prospect’s needs 4 Reviewing pipeline 5 Researching a customer’s/prospect’s current solution Base: Sales representatives Salesforce Research
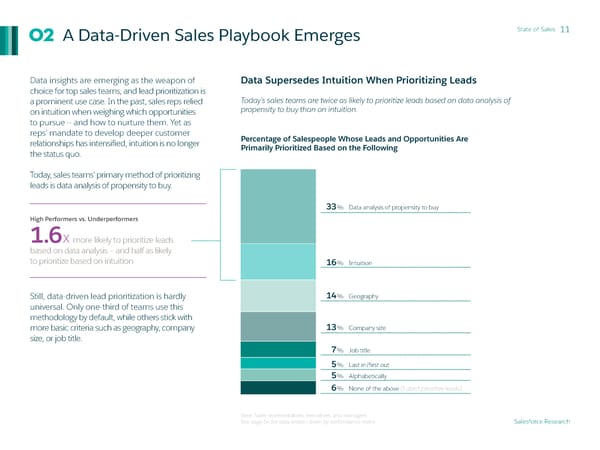
02 A Data-Driven Sales Playbook Emerges State of Sales 11 Data insights are emerging as the weapon of Data Supersedes Intuition When Prioritizing Leads choice for top sales teams, and lead prioritization is a prominent use case. In the past, sales reps relied Today’s sales teams are twice as likely to prioritize leads based on data analysis of on intuition when weighing which opportunities propensity to buy than on intuition. to pursue — and how to nurture them. Yet as reps’ mandate to develop deeper customer Percentage of Salespeople Whose Leads and Opportunities Are relationships has intensified, intuition is no longer Primarily Prioritized Based on the Following the status quo. Today, sales teams’ primary method of prioritizing leads is data analysis of propensity to buy. 33% Data analysis of propensity to buy High Performers vs. Underperformers 1.6X more likely to prioritize leads based on data analysis — and half as likely to prioritize based on intuition 16% Intuition Still, data-driven lead prioritization is hardly 14% Geography universal. Only one-third of teams use this methodology by default, while others stick with more basic criteria such as geography, company 13% Company size size, or job title. 7% Job title 5% Last in/first out 5% Alphabetically 6% None of the above (I don’t prioritize leads) Base: Sales representatives, executives, and managers See page 54 for data broken down by performance levels. Salesforce Research
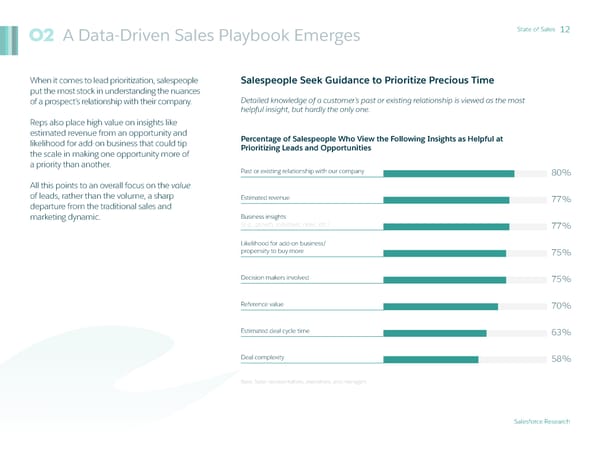
A Data-Driven Sales Playbook Emerges State of Sales 12 02 When it comes to lead prioritization, salespeople Salespeople Seek Guidance to Prioritize Precious Time put the most stock in understanding the nuances of a prospect’s relationship with their company. Detailed knowledge of a customer’s past or existing relationship is viewed as the most helpful insight, but hardly the only one. Reps also place high value on insights like estimated revenue from an opportunity and Percentage of Salespeople Who View the Following Insights as Helpful at likelihood for add-on business that could tip Prioritizing Leads and Opportunities the scale in making one opportunity more of a priority than another. Past or existing relationship with our company 80% All this points to an overall focus on the value of leads, rather than the volume, a sharp Estimated revenue 77% departure from the traditional sales and marketing dynamic. Business insights (e.g., growth, initiatives, news, etc.) 77% Likelihood for add-on business/ propensity to buy more 75% Decision makers involved 75% Reference value 70% Estimated deal cycle time 63% Deal complexity 58% Base: Sales representatives, executives, and managers Salesforce Research
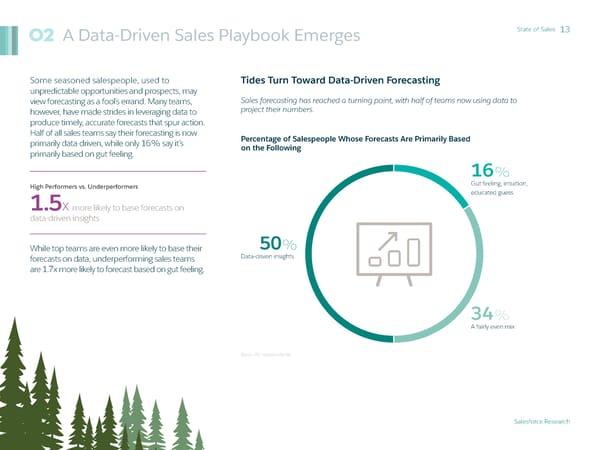
02 A Data-Driven Sales Playbook Emerges State of Sales 13 Some seasoned salespeople, used to Tides Turn Toward Data-Driven Forecasting unpredictable opportunities and prospects, may view forecasting as a fool’s errand. Many teams, Sales forecasting has reached a turning point, with half of teams now using data to however, have made strides in leveraging data to project their numbers. produce timely, accurate forecasts that spur action. Half of all sales teams say their forecasting is now Percentage of Salespeople Whose Forecasts Are Primarily Based primarily data-driven, while only 16% say it’s on the Following primarily based on gut feeling. 16% High Performers vs. Underperformers Gut feeling, intuition, 1.5X more likely to base forecasts on educated guess data-driven insights While top teams are even more likely to base their 50% forecasts on data, underperforming sales teams Data-driven insights are 1.7x more likely to forecast based on gut feeling. 34% A fairly even mix Base: All respondents Salesforce Research
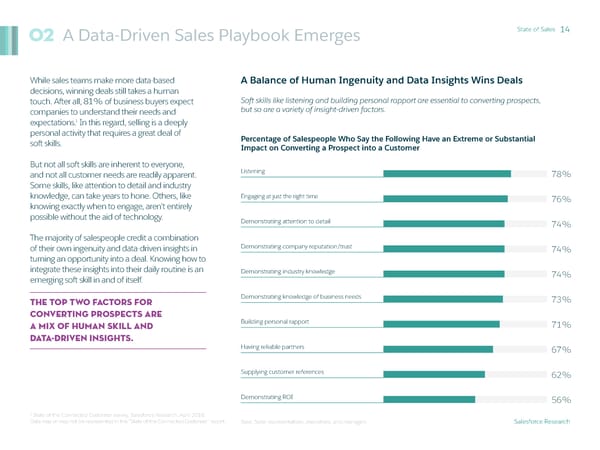
02 A Data-Driven Sales Playbook Emerges State of Sales 14 While sales teams make more data-based A Balance of Human Ingenuity and Data Insights Wins Deals decisions, winning deals still takes a human touch. After all, 81% of business buyers expect Soft skills like listening and building personal rapport are essential to converting prospects, companies to understand their needs and but so are a variety of insight-driven factors. 1 expectations. In this regard, selling is a deeply personal activity that requires a great deal of Percentage of Salespeople Who Say the Following Have an Extreme or Substantial soft skills. Impact on Converting a Prospect into a Customer But not all soft skills are inherent to everyone, and not all customer needs are readily apparent. Listening 78% Some skills, like attention to detail and industry knowledge, can take years to hone. Others, like Engaging at just the right time 76% knowing exactly when to engage, aren't entirely possible without the aid of technology. Demonstrating attention to detail 74% The majority of salespeople credit a combination of their own ingenuity and data-driven insights in Demonstrating company reputation/trust 74% turning an opportunity into a deal. Knowing how to integrate these insights into their daily routine is an Demonstrating industry knowledge 74% emerging soft skill in and of itself. The top two factors for Demonstrating knowledge of business needs 73% converting prospects are a mix of human skill and Building personal rapport 71% data-driven insights. Having reliable partners 67% Supplying customer references 62% Demonstrating ROI 56% 1 State of the Connected Customer survey, Salesforce Research, April 2018. Data may or may not be represented in the “State of the Connected Customer” report. Base: Sales representatives, executives, and managers Salesforce Research
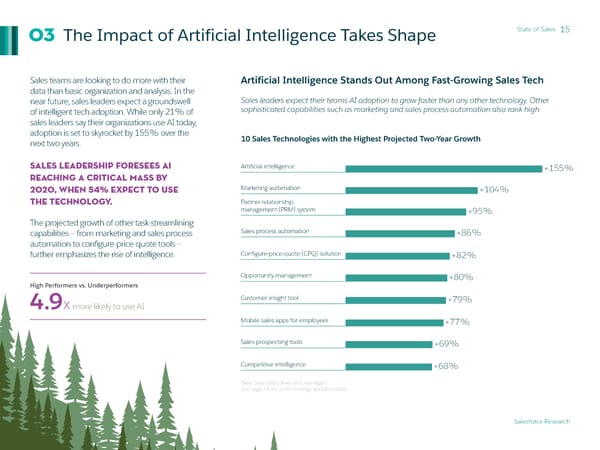
The Impact of Artificial Intelligence Takes Shape State of Sales 15 03 Sales teams are looking to do more with their Artificial Intelligence Stands Out Among Fast-Growing Sales Tech data than basic organization and analysis. In the near future, sales leaders expect a groundswell Sales leaders expect their teams AI adoption to grow faster than any other technology. Other of intelligent tech adoption. While only 21% of sophisticated capabilities such as marketing and sales process automation also rank high. sales leaders say their organizations use AI today, adoption is set to skyrocket by 155% over the 10 Sales Technologies with the Highest Projected Two-Year Growth next two years. Sales leadership foresees AI Artificial intelligence +155% reaching a critical mass by 2020, when 54% expect to use Marketing automation +104% the technology. Partner relationship management (PRM) system +95% The projected growth of other task-streamlining capabilities — from marketing and sales process Sales process automation +86% automation to configure-price-quote tools — further emphasizes the rise of intelligence. Configure-price-quote (CPQ) solution +82% Opportunity management +80% High Performers vs. Underperformers 4.9X more likely to use AI Customer insight tool +79% Mobile sales apps for employees +77% Sales prospecting tools +69% Competitive intelligence +68% Base: Sales executives and managers See page 45 for all technology adoption data. Salesforce Research
Spotlight State of Sales 16 As AI Gains Momentum, People Remain the Backbone of Sales AI Is Not Replacing Salespeople Sales remains a growing profession, with the majority of teams increasing the number of reps on staff. AI’s rapid ascent has elicited job security fears Hiring trends show that teams already using AI are more likely to have added reps over the past three years. across many roles — and sales is no exception. Yet today’s customers say they want Percentage of Sales Teams Whose Rep Staff Levels Have consultative, trusted advisors focused on Changed as Follows Over the Past Three Years achieving their unique needs — an innately human pursuit. AI’s role for salespeople is not 76% 22% 3% to replace them, but to help them understand Currently using AI their customers’ needs better — while easing 67% 28% 5% the burden of manual Planning to use AI within two years tasks — thereby empowering them as advisors. Not planning to use AI 48% 45% 7% This dynamic is reflected in hiring trends among sales teams using AI. The majority of sales teams are adding staff, including over Increased Maintained Decreased three-quarters of teams already using AI. Base: Sales executives and managers 76% of teams using AI have increased sales rep staff since 2015. SALES LEADER INSIGHT “AI is digital, humans are analog. The difference is important. When we have sufficiently large data sets, we can rightly hold algorithms to higher standards of accuracy and consistency, but we can’t infuse the algorithm with judgment, integrity, creativity or compassion.” — Donal Daly, Executive Chairman, Altify, Inc. Salesforce Research
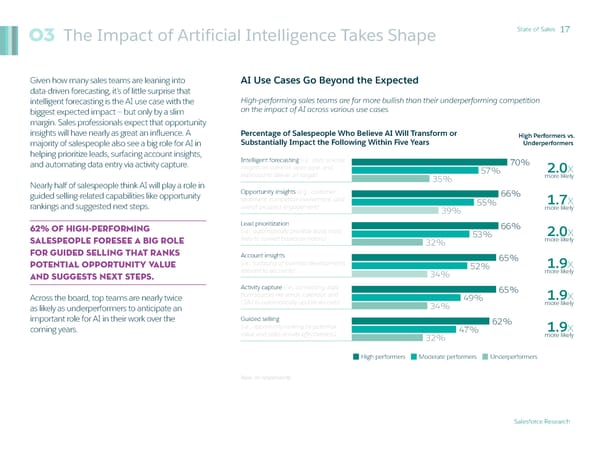
The Impact of Artificial Intelligence Takes Shape State of Sales 17 03 Given how many sales teams are leaning into AI Use Cases Go Beyond the Expected data-driven forecasting, it’s of little surprise that intelligent forecasting is the AI use case with the High-performing sales teams are far more bullish than their underperforming competition biggest expected impact — but only by a slim on the impact of AI across various use cases. margin. Sales professionals expect that opportunity insights will have nearly as great an influence. A Percentage of Salespeople Who Believe AI Will Transform or High Performers vs. majority of salespeople also see a big role for AI in Substantially Impact the Following Within Five Years Underperformers helping prioritize leads, surfacing account insights, Intelligent forecasting (i.e., data science and automating data entry via activity capture. insights on commit, open pipe, and 70% 2.0x likelihood to deliver on target) 57% more likely Nearly half of salespeople think AI will play a role in 35% guided selling-related capabilities like opportunity Opportunity insights (e.g., customer 66% sentiment, competitor involvement, and 55% 1.7x rankings and suggested next steps. overall prospect engagement) 39% more likely 62% of high-PERFORMING Lead prioritization 66% (i.e., automatically prioritize leads most 53% 2.0x SALESPEOPLE foresee a big role likely to convert based on history) 32% more likely for guided selling that ranks Account insights 65% potential opportunity value (i.e., surfacing of business developments 52% 1.9x and suggests next steps. relevant to accounts) 34% more likely Activity capture (i.e., connecting data 65% Across the board, top teams are nearly twice from sources like email, calendar, and 49% 1.9x as likely as underperformers to anticipate an CRM to automatically update records) 34% more likely important role for AI in their work over the Guided selling 62% coming years. (i.e., opportunity ranking by potential 47% 1.9x value and sales activity effectiveness) 32% more likely High performers Moderate performers Underperformers Base: All respondents Salesforce Research
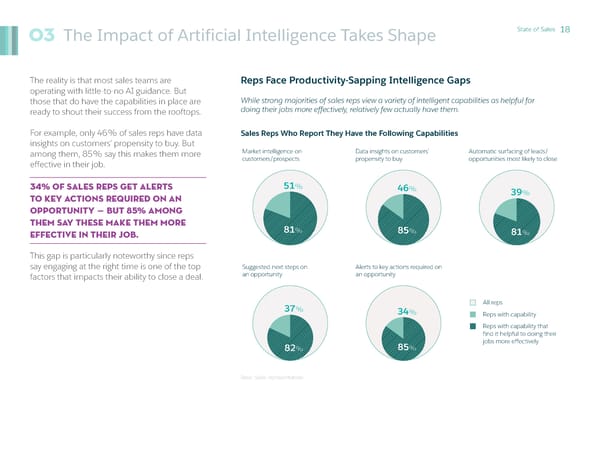
The Impact of Artificial Intelligence Takes Shape State of Sales 18 03 The reality is that most sales teams are Reps Face Productivity-Sapping Intelligence Gaps operating with little-to-no AI guidance. But those that do have the capabilities in place are While strong majorities of sales reps view a variety of intelligent capabilities as helpful for ready to shout their success from the rooftops. doing their jobs more effectively, relatively few actually have them. For example, only 46% of sales reps have data Sales Reps Who Report They Have the Following Capabilities insights on customers’ propensity to buy. But among them, 85% say this makes them more Market intelligence on Data insights on customers’ Automatic surfacing of leads/ effective in their job. customers/prospects propensity to buy opportunities most likely to close 34% of sales reps get alerts 51% 46% 39% to key actions required on an opportunity — but 85% among them say these make them more 81% 85% effective in their job. 81% This gap is particularly noteworthy since reps say engaging at the right time is one of the top Suggested next steps on Alerts to key actions required on factors that impacts their ability to close a deal. an opportunity an opportunity 37% All reps 34% Reps with capability Reps with capability that find it helpful to doing their 82% 85% jobs more effectively 82% 85% Base: Sales representatives
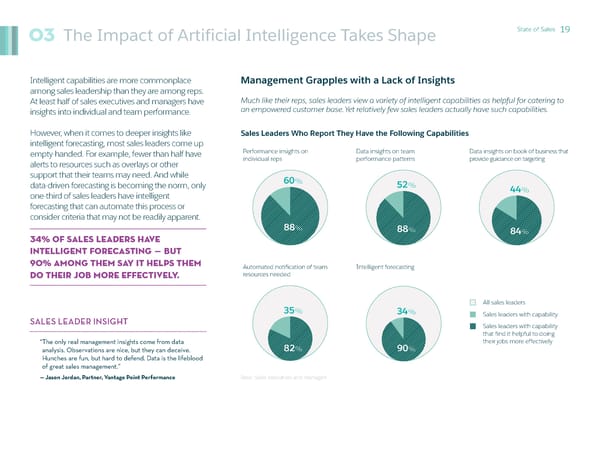
The Impact of Artificial Intelligence Takes Shape State of Sales 19 03 Intelligent capabilities are more commonplace Management Grapples with a Lack of Insights among sales leadership than they are among reps. At least half of sales executives and managers have Much like their reps, sales leaders view a variety of intelligent capabilities as helpful for catering to insights into individual and team performance. an empowered customer base. Yet relatively few sales leaders actually have such capabilities. However, when it comes to deeper insights like Sales Leaders Who Report They Have the Following Capabilities intelligent forecasting, most sales leaders come up empty-handed. For example, fewer than half have Performance insights on Data insights on team Data insights on book of business that alerts to resources such as overlays or other individual reps performance patterns provide guidance on targeting support that their teams may need. And while 60% data-driven forecasting is becoming the norm, only 52% 44% one-third of sales leaders have intelligent forecasting that can automate this process or consider criteria that may not be readily apparent. 88% 88% 84% 34% of sales leaders have intelligent forecasting — but 90% among them say it helps them Automated notification of team Intelligent forecasting do their job more effectively. resources needed All sales leaders 35% 34% Sales leaders with capability SALES LEADER INSIGHT Sales leaders with capability that find it helpful to doing “The only real management insights come from data 82% 90% their jobs more effectively analysis. Observations are nice, but they can deceive. Hunches are fun, but hard to defend. Data is the lifeblood of great sales management.” — Jason Jordan, Partner, Vantage Point Performance Base: Sales executives and managers
Virtual Sales Hits a Tipping Point State of Sales 20 04 Despite being overloaded with tasks, salespeople Selling Has Gone Virtual are making a big effort to spend more time with customers and prospects. Time spent meeting with customers virtually has increased at a rate over three times that of meeting in person. In an era of constant connectivity, the biggest gains are in time spent connecting virtually. In fact, 60% Percentage of Sales Reps Who Spend More or Less Time Net Change of reps report an increase in virtual meetings over on the Following Compared to 2015 Since 2015 the last three years. What’s more, there are three In front of a screen times as many sales reps who now spend less time (i.e., time on a computer, tablet, 62% 30% 8% with customers in person than there are those who or smartphone) +12% spend less time with them virtually. Connecting virtually with customers/prospects 60% 32% 8% This shifting dynamic coincides with a (e.g., via Hangouts, Skype, email, etc.) +12% general trend toward screen time, in general, among salespeople. Meeting in person with 48% 30% 23% customers/prospects +4% Sales reps have increased their time connecting virtually with Increased Stayed the same Decreased customers at a rate 3x greater Base: Sales representatives than connecting in person. SALES LEADER INSIGHT “Among the many factors driving the increase in virtual selling, buyer preference stands out. Buyers are digital-first and don’t feel the need for face-to-face communication.” — Trish Bertuzzi, President & Chief Strategist, The Bridge Group Salesforce Research
Virtual Sales Hits a Tipping Point State of Sales 21 04 As selling goes virtual, hiring practices are reflecting Inside Roles Take Center Stage this trend. On average, staffing of inside sales roles has increased by 7% since 2015, and sales Since 2015, the average sales team has increased their inside sales rep headcount by 7% and development reps have increased by 6%. their sales development rep headcount by 6%. Sales performance and inside staffing trends Percentage of Sales Teams Whose Staff Levels Have Changed march in lockstep; high performers are 2.3x more as Follows Over the Past Three Years likely than underperformers to have hired more High Perfomers vs. inside reps, and 2.7x more likely to have hired Inside Sales Reps Underperfomers more sales development reps. 54% 41% 5% While sales leaders cite a variety of reasons for High performers shifting to an inside sales staffing model — including better opportunity for rep specialization 41% 53% 5% 2.3x and lower costs — improved technology ranks as Moderate performers more likely to the top motivator. have increased Underperformers 24% 66% 10% Top 5 Reasons Given for Hiring More Inside or Increased Stayed the same Decreased Sales Development Reps 1 Improved technology that makes High Perfomers vs. inside reps more effective Sales Development Reps Underperfomers 2 Better opportunities for rep specialization 55% 42% 3% without a larger field territory High performers 3 Improved team dynamics/cohesion Moderate performers 37% 57% 6% 2.7x Better suited to our dispersed customer base more likely to 4 have increased 5 Lower business costs Underperformers 20% 69% 11% Increased Stayed the same Decreased Base: Sales executives and managers Base: Sales executives and managers Salesforce Research
Spotlight State of Sales 22 The Technology Stacks Powering Sales Analytics Reigns as the Most Adopted Sales Technology Looking at the most widely used sales Sales reporting and analytics is used by over two-thirds of sales teams, followed by account and technologies could help explain the shift to contact management and customer relationship management (CRM) systems. virtual selling. Sales reporting and analytics tops the list 10 Sales Technologies with the Highest Adoption of technologies used, with over two-thirds of teams keeping tabs on the state of their Sales reporting/analytics 68% customers, opportunities, and pipeline. Other data-centric technologies popular among sales teams include account and contact Account and contact management 65% management, sales forecasting tools, and Customer relationship customer relationship management (CRM) management (CRM) system 58% systems that organize all this data in a central location. Sales forecasting tools 56% Rounding out the 10 most popular sales Sales coaching and technologies are mobile sales apps. Sales training solution 54% managers and execs expect mobile sales app adoption will jump 70% by 2020 (see Email/CRM integration 51% page 48) — perhaps to appease the 73% of business buyers who say on-demand Compensation/incentive engagement is very important for winning management 49% 1 their business. Sales prospecting tools 47% Competitive intelligence 47% Mobile sales apps for employees 46% 1 State of the Connected Customer survey, Salesforce Research, April 2018. Data may or may not be represented in the “State of the Connected Base: All respondents Customer” report. See page 46 for all technology adoption data. Salesforce Research
Top Sales Teams Break from the Silo Mentality State of Sales 23 05 As executive leadership focuses on delighting Sales Values a Connected Customer View customers, sales teams recognize that connected experiences entail far more than sales interactions. Strong majorities of salespeople cite a single, shared view of customer data across marketing, sales, In fact, 75% of business buyers say connected and service interactions as important for a variety of objectives that impact the bottom line. processes — across marketing, sales, and service interactions — are very important to winning Percentage of Salespeople Who Say a Connected View of Customer Data 1 their business. Is Important to the Following Seventy-seven percent of salespeople say selling collaboratively with other departments is important. Increasing customer satisfaction 88% This model is akin to selling by committee, through which various perspectives from across the customer Aquiring new customers 86% journey are incorporated. To make this approach work, 81% say a Closing more deals 83% connected view of data across the customer journey is important. Teams increasingly rely on this Empowering reps to be proactive 83% 360-degree customer view of marketing campaign engagement, service history, and more to not only Reducing customer attrition/increasing increase customer satisfaction, but ramp up their customer loyalty 79% own productivity. Empowering reps to look beyond transactions 79% In the tangle of disparate legacy systems and APIs, a true, 360-degree customer view requires linked Increasing average deal size/order value 75% data sources — yet only 49% of sales teams have such fully integrated systems. Shortening sales cycles 71% Base: All respondents High Performers vs. Underperformers 2.1X more likely than underperformers to have fully integrated systems 1 State of the Connected Customer survey, Salesforce Research, April 2018. Data may or may not be represented in the “State of the Connected Customer” report. Salesforce Research
Top Sales Teams Break from the Silo Mentality State of Sales 24 05 Collaborative selling demands sales and marketing Marketing Partnerships Signal High-Performing Sales alignment. After all, 74% of business buyers say in order to win their business it’s very important for Top sales teams are highly likely to share common metrics and data sources with each other. salespeople to be aware of marketing campaigns Most importantly, they’re likely to know why they’re receiving a lead. 1 and offers. True collaborative selling, however, extends beyond merely knowing the offers to Percentage of Salespeople Who Agree with the Following Statements High Performers vs. understanding precisely which ones resonate with About Their Relationships with Marketing Colleagues Underperformers customers. This alignment has become a best practice; the majority of teams across performance Sales and marketing teams share 88% 1.4x levels say they’re empowered to collaborate and common goals/metrics 77% more likely share common goals and metrics. 61% Sales and marketing teams are 86% 1.3x empowered to collaborate 79% more likely High Performers vs. Underperformers 66% There is a free and open flow of 85% 1.9X more likely than those on customer data between sales and 75% 1.5x marketing teams 56% more likely underperforming teams to always understand why marketing passes them a lead 83% I always understand why the marketing 71% 1.9x team is passing me a lead 43% more likely Another disparity between top sales teams and 82% their underperforming peers is the ubiquity of Sales and marketing have a standard 76% 1.4x account-based marketing (ABM) — programs in process for collaboration 57% more likely which messages and offers are targeted to a Sales and marketing teams 80% market of one. This practice is in place for execute jointly on account-based 71% 1.7x 80% of high-performing teams, but only 47% marketing programs 47% more likely of underperformers. High performers Moderate performers Underperformers Base: All respondents 1 State of the Connected Customer survey, Salesforce Research, April 2018. Data may or may not be represented in the “State of the Connected Customer” report. Salesforce Research
Top Sales Teams Break from the Silo Mentality State of Sales 25 05 A collaborative selling structure doesn’t stop Sales and Service Alignment Becomes the Norm with sales and marketing; 77% of business buyers expect salespeople to be aware of Across the performance spectrum, the majority of sales teams are now empowered to collaborate 1 with service colleagues, and have implemented processes to ensure they work in tandem. service interactions. Companies are increasingly judged by the quality Percentage of Salespeople Who Agree with the Following Statements High Performers vs. of their customer service, compelling reps to stay in About Their Relationships with Service Colleagues Underperformers lockstep with customers’ ongoing needs. What’s There is a free and open flow of more, tight collaboration between sales and customer data between sales and 84% 1.4x service teams may surface opportunities that’d service teams 74% more likely otherwise go unnoticed. 59% Sales and service teams are 83% 1.3x Collaboration, common goals, and shared empowered to collaborate 79% more likely customer data are now common practices among 65% all sales and service teams, with high performers Service reps proavtively alert sales reps 83% 1.6x leading the pack once again. to opportunities 72% more likely 53% Sales and service teams share common 81% 1.4x High Performers vs. Underperformers goals and metrics 74% more likely 1.6X more likely than underperformers 59% Sales and service teams have standard 81% 1.5x to say service reps proactively alert them processes for collaboration 74% more likely about opportunities 54% High performers Moderate performers Underperformers Base: All respondents SALES LEADER INSIGHT “The trifecta of delivering a compelling and meaningful customer experience happens when sales, customer service, marketing are all focused on customer success and how to measure it, instead of siloed objectives.” — Tiffani Bova, Global Customer Growth and Innovation Evangelist, Salesforce 1 State of the Connected Customer survey, Salesforce Research, April 2018. Data may or may not be represented in the “State of the Connected Customer” report. Salesforce Research
State of Sales Spotlight 26 Channel Partners Extend Sales’ Reach Top Teams Take a Resourced Approach to Channel Sales Among salespeople at companies with While many sales teams agree on providing channel partners with resources, high-performing channel or partner programs, 72% say they’re teams are far more likely to value learning management systems and automated onboarding. important to their overall sales processes. Such strategies can extend the reach of core teams Percentage of Salespeople Who Consider the Following High Performers vs. into new industries, territories, and segments Channel/Partner Sales Resources as Important Underperformers without significant additional overhead. 86% 1.4x But as customers come to expect consistency Qualified leads 76% more likely across all interactions, sales leaders are 62% mindful to arm their partners with the 83% 1.8x right resources. Enablement resources 74% more likely 46% The majority of salespeople at companies 82% 1.3x with partner sales programs prioritize things Opportunity management 77% more likely like opportunity management resources, 64% marketing development funds, distributed 80% 1.4x marketing capabilities, and channel analytics. Channel analytics 70% more likely Yet high-performing teams diverge from 59% underperformers by also placing high value 80% 2.0x on additional resources — such as enablement Learning management system (LMS) 67% more likely resources, learning management, and 41% automated onboarding. 79% 1.3x Distributed marketing capabilities 70% more likely 63% 77% 2.4x Automated onboarding 60% more likely 32% 77% 1.2x Marketing development funds 72% more likely 62% Base: Channel/partner sales representatives High performers Moderate performers Underperformers OR sales executives and managers of teams using channel/partner programs
Last Look State of Sales 27 4 Practices That Drive Sales and Customer Success Rally Around the 04 Customer Journey Get Smart With customers demanding 03 consistent, contextualized, and About AI personalized experiences, selling Trade Intuition AI is projected to grow faster than is a team sport with reps playing 02 for Insights any other sales technology — and quarterback. Shared views of little wonder, since teams expect customer data across not just Make Time It’s been said that selling is an it to make a tremendous impact sales and marketing or sales and 01 for Selling art form — but that doesn’t mean on a variety of use cases. Rather service — but the three together — we can ignore the science. Sales than viewing AI as an existential are a critical ingredient for Winning deals and fostering loyalty teams in general, and particularly threat, teams that embrace AI to customer success. with today’s customers takes far high performers, are taking a new bolster reps’ performance may more than a good product at approach to selling: sharpening have a leg up in meeting — and the right price. Salespeople must their skills with data-driven insights. even predicting — their customers’ look beyond the transaction by As these insights become more expectations. demonstrating a thorough ingrained in top teams’ processes, understanding of their customers’ those without them risk falling unique needs, expectations, and behind the competition. circumstances. Teams whose reps are weighed down by processes and tasks will find it harder to meet elevated customer expectations. Salesforce Research
* Country Profiles * Please keep in mind that cultural bias impacts survey results across regions. Salesforce Research
Country Profile State of Sales 29 United States (500 Sales Professionals) Top Sales Metrics Top Sales Technologies Top KPIs currently tracked by sales teams* Top technologies currently used by sales teams 73% 69% 68% 71% 70% 66% Team quota met Customer satisfaction (CSAT) Individual quota met Sales reporting/analytics Account and contact management Sales forecasting tools Top KPIs for anticipated growth over the next two years* Top technologies for anticipated growth over the next two years* Partner relationship Net Promoter Customer lifetime Artificial management Marketing +101%Score (NPS) +91%Pipeline accuracy +75%value (CLV) +153%intelligence +91%(PRM) solution +86%automation Rep Quota Attainment Artificial Intelligence Use 58%of sales reps expect to miss their annual quota this year 23%of sales teams currently use artificial intelligence Rep Time Allocation Data-Driven Sales Reps have increased time spent engaging with customers/ Sales teams primarily prioritize leads based on:** Sales teams primarily forecast sales based on: prospects in the following ways over the past three years: 35% Connecting Meeting in Selling 18% 64%virtually 43%person 65% 38% Not selling 46% 52% +18%Net change +5%Net change 30% Time reps spend selling vs. 16% not selling in an average week Cross-Team Collaboration Data analysis of propensity to buy Data-driven insights Intuition A fairly even mix Other Gut feeling, intuition, educated guess Sales teams that share common goals and metrics with: Marketing 83% Service 78% * Base: Sales executives and managers ** Base: Sales executives, managers, and reps Salesforce Research
Country Profile State of Sales 30 Canada (300 Sales Professionals) Top Sales Metrics Top Sales Technologies Top KPIs currently tracked by sales teams* Top technologies currently used by sales teams 74% 69% 64% 75% 67% 63% Team quota met Individual quota met Customer satisfaction (CSAT) Sales reporting/analytics Account and contact management Sales forecasting tools Top KPIs for anticipated growth over the next two years* Top technologies for anticipated growth over the next two years* Customer artner relationship P Net Promoter Pipeline acquisition Artificial Customer management +212%Score (NPS) +135%accuracy +97%cost (CAC) +226%intelligence +162%insight tool +142%(PRM) solution Rep Quota Attainment Artificial Intelligence Use 51%of sales reps expect to miss their annual quota this year 13%of sales teams currently use artificial intelligence Rep Time Allocation Data-Driven Sales Reps have increased time spent engaging with customers/ Sales teams primarily prioritize leads based on:** Sales teams primarily forecast sales based on: prospects in the following ways over the past three years: 37% 12% Connecting Meeting in Selling 57%virtually 40%person 63% 29% Not selling 52% 51% +15%Net change +3%Net change 18% 37% Time reps spend selling vs. not selling in an average week Cross-Team Collaboration Data analysis of propensity to buy Data-driven insights Intuition A fairly even mix Other Gut feeling, intuition, educated guess Sales teams that share common goals and metrics with: Marketing 77% Service 76% * Base: Sales executives and managers ** Base: Sales executives, managers, and reps Salesforce Research
Country Profile State of Sales 31 United Kingdom/Ireland (300 Sales Professionals) Top Sales Metrics Top Sales Technologies Top KPIs currently tracked by sales teams* Top technologies currently used by sales teams 82% 75% 72% 75% 67% 66% Customer satisfaction (CSAT) Team quota met Individual quota met Sales reporting/analytics Account and contact management Customer relationship management (CRM) system Top KPIs for anticipated growth over the next two years* Top technologies for anticipated growth over the next two years* Configure- Pipeline Net Promoter Customer lifetime price-quote Artificial Sales process +92%accuracy +69%Score (NPS) +63%value (CLV) +126%(CPQ) solution +112%intelligence +95%automation Rep Quota Attainment Artificial Intelligence Use 64%of sales reps expect to miss their annual quota this year 26%of sales teams currently use artificial intelligence Rep Time Allocation Data-Driven Sales Reps have increased time spent engaging with customers/ Sales teams primarily prioritize leads based on:** Sales teams primarily forecast sales based on: prospects in the following ways over the past three years: 35% Connecting Meeting in Selling 16% 45%virtually 25%person 65% 40% 37% Not selling 53% +11%Net change -2%Net change 31% Time reps spend selling vs. 23% not selling in an average week Cross-Team Collaboration Data analysis of propensity to buy Data-driven insights Intuition A fairly even mix Other Gut feeling, intuition, educated guess Sales teams that share common goals and metrics with: Marketing 81% Service 77% * Base: Sales executives and managers ** Base: Sales executives, managers, and reps Salesforce Research
Country Profile State of Sales 32 France (300 Sales Professionals) Top Sales Metrics Top Sales Technologies Top KPIs currently tracked by sales teams* Top technologies currently used by sales teams 69% 67% 61% 74% 72% 60% Customer satisfaction (CSAT) Team quota met Individual quota met Account and contact management Sales reporting/analytics Sales coaching and training solution Top KPIs for anticipated growth over the next two years* Top technologies for anticipated growth over the next two years* Customer Customer e ess ting tificial lifetime value Net Promoter acquisition cost Sales proc Mark Ar +135%(CLV) +126%Score (NPS) +122%(CAC) +136%automation +135%automation +118%intelligence Rep Quota Attainment Artificial Intelligence Use 56%of sales reps expect to miss their annual quota this year 25%of sales teams currently use artificial intelligence Rep Time Allocation Data-Driven Sales Reps have increased time spent engaging with customers/ Sales teams primarily prioritize leads based on:** Sales teams primarily forecast sales based on: prospects in the following ways over the past three years: 34% Connecting Meeting in Selling 18% 70%virtually 47%person 66% 29% Not selling 60% 45% +13%Net change +2%Net change 11% 37% Time reps spend selling vs. not selling in an average week Cross-Team Collaboration Data analysis of propensity to buy Data-driven insights Intuition A fairly even mix Other Gut feeling, intuition, educated guess Sales teams that share common goals and metrics with: Marketing 77% Service 77% * Base: Sales executives and managers ** Base: Sales executives, managers, and reps Salesforce Research
Country Profile State of Sales 33 Germany (322 Sales Professionals) Top Sales Metrics Top Sales Technologies Top KPIs currently tracked by sales teams* Top technologies currently used by sales teams 73% 60% 58% 68% 64% 56% Customer satisfaction (CSAT) Individual quota met Customer retention/attrition Account and contact management Competitive intelligence Customer relationship management (CRM) system Top KPIs for anticipated growth over the next two years* Top technologies for anticipated growth over the next two years* figure- Con Net Promoter Customer lifetime Pipeline price-quote Opportunity Artificial +211%Score (NPS) +171%value (CLV) +88%accuracy +221%(CPQ) solution +189%management +128%intelligence Rep Quota Attainment Artificial Intelligence Use 53%of sales reps expect to miss their annual quota this year 33%of sales teams currently use artificial intelligence Rep Time Allocation Data-Driven Sales Reps have increased time spent engaging with customers/ Sales teams primarily prioritize leads based on:** Sales teams primarily forecast sales based on: prospects in the following ways over the past three years: 33% Connecting Meeting in Selling 14% 57%virtually 65%person 67% 33% Not selling 57% 52% +7%Net change +6%Net change 34% 11% Time reps spend selling vs. not selling in an average week Cross-Team Collaboration Data analysis of propensity to buy Data-driven insights Intuition A fairly even mix Other Gut feeling, intuition, educated guess Sales teams that share common goals and metrics with: Marketing 84% Service 84% * Base: Sales executives and managers ** Base: Sales executives, managers, and reps Salesforce Research
Country Profile State of Sales 34 Netherlands (232 Sales Professionals) Top Sales Metrics Top Sales Technologies Top KPIs currently tracked by sales teams* Top technologies currently used by sales teams 67% 52% 50% 66% 66% 59% Customer satisfaction (CSAT) Customer acquisition cost (CAC) Customer retention/attrition Customer relationship management Account and contact management Email/CRM integration (CRM) system & sales reporting/analytics Top KPIs for anticipated growth over the next two years* Top technologies for anticipated growth over the next two years* rtner relationship Customer usage Pa Pipeline Net Promoter (e.g., consumption, Artificial management Competitive +180%accuracy +141%Score (NPS) +87%deployment, utilization) +137%intelligence +106%(PRM) solution +90%intelligence Rep Quota Attainment Artificial Intelligence Use 41%of sales reps expect to miss their annual quota this year 33%of sales teams currently use artificial intelligence Rep Time Allocation Data-Driven Sales Reps have increased time spent engaging with customers/ Sales teams primarily prioritize leads based on:** Sales teams primarily forecast sales based on: prospects in the following ways over the past three years: 32% Connecting Meeting in Selling 17% 68%virtually 66%person 68% 31% Not selling 49% 53% +11%Net change +7%Net change 31% 20% Time reps spend selling vs. not selling in an average week Cross-Team Collaboration Data analysis of propensity to buy Data-driven insights Intuition A fairly even mix Other Gut feeling, intuition, educated guess Sales teams that share common goals and metrics with: Marketing 82% Service 75% * Base: Sales executives and managers ** Base: Sales executives, managers, and reps Salesforce Research
Country Profile State of Sales 35 Japan (300 Sales Professionals) Top Sales Metrics Top Sales Technologies Top KPIs currently tracked by sales teams* Top technologies currently used by sales teams 78% 74% 56% 67% 56% 52% Team quota met Individual quota met Customer retention/attrition Sales reporting/analytics Competitive intelligence Account and contact management Top KPIs for anticipated growth over the next two years* Top technologies for anticipated growth over the next two years* romoter Sales process Pipeline Customer lifetime Net P Artificial Marketing +125%accuracy +92%value (CLV) +64%Score (NPS) +550%intelligence +233%automation +141%automation Rep Quota Attainment Artificial Intelligence Use 54%of sales reps expect to miss their annual quota this year 11%of sales teams currently use artificial intelligence Rep Time Allocation Data-Driven Sales Reps have increased time spent engaging with customers/ Sales teams primarily prioritize leads based on:** Sales teams primarily forecast sales based on: prospects in the following ways over the past three years: 38% Connecting Meeting in Selling 24% 43%virtually 34%person 62% 26% Not selling 56% 47% +10%Net change +1%Net change 18% 30% Time reps spend selling vs. not selling in an average week Cross-Team Collaboration Data analysis of propensity to buy Data-driven insights Intuition A fairly even mix Other Gut feeling, intuition, educated guess Sales teams that share common goals and metrics with: Marketing 62% Service 57% * Base: Sales executives and managers ** Base: Sales executives, managers, and reps Salesforce Research
Country Profile State of Sales 36 Australia/New Zealand (300 Sales Professionals) Top Sales Metrics Top Sales Technologies Top KPIs currently tracked by sales teams* Top technologies currently used by sales teams 63% 59% 53% 60% 54% 53% Customer satisfaction (CSAT) Individual quota met Customer retention/attrition Sales reporting/analytics Sales forecasting tools Account and contact management Top KPIs for anticipated growth over the next two years* Top technologies for anticipated growth over the next two years* titive Mobile sales apps Net Promoter Customer Artificial Compe +130%Score (NPS) +98%acquisition cost (CAC) +92%Pipeline accuracy +142%intelligence +117%intelligence +94%for employees Rep Quota Attainment Artificial Intelligence Use 70%of sales reps expect to miss their annual quota this year 31%of sales teams currently use artificial intelligence Rep Time Allocation Data-Driven Sales Reps have increased time spent engaging with customers/ Sales teams primarily prioritize leads based on:** Sales teams primarily forecast sales based on: prospects in the following ways over the past three years: 31% 12% Connecting Meeting in Selling 57%virtually 52%person 69% 30% Not selling 54% 35% 54% +6%Net change +4%Net change 17% Time reps spend selling vs. not selling in an average week Cross-Team Collaboration Data analysis of propensity to buy Data-driven insights Intuition A fairly even mix Other Gut feeling, intuition, educated guess Sales teams that share common goals and metrics with: Marketing 78% Service 71% * Base: Sales executives and managers ** Base: Sales executives, managers, and reps Salesforce Research
Country Profile State of Sales 37 Hong Kong (163 Sales Professionals) Top Sales Metrics Top Sales Technologies Top KPIs currently tracked by sales teams* Top technologies currently used by sales teams 60% 58% 57% 72% 66% 63% Individual quota met & team quota met Customer satisfaction (CSAT) Customer usage (e.g., consumption, Sales reporting/analytics Account and contact management Customer relationship management deployment, utilization) (CRM) system Top KPIs for anticipated growth over the next two years* Top technologies for anticipated growth over the next two years* Partner relationship Customer lifetime Pipeline Net Promoter Artificial Marketing management +136%value (CLV) +106%accuracy +100%Score (NPS) +176%intelligence +144%automation +132%(PRM) solution Rep Quota Attainment Artificial Intelligence Use 66%of sales reps expect to miss their annual quota this year 23%of sales teams currently use artificial intelligence Rep Time Allocation Data-Driven Sales Reps have increased time spent engaging with customers/ Sales teams primarily prioritize leads based on:** Sales teams primarily forecast sales based on: prospects in the following ways over the past three years: 34% Connecting Meeting in Selling 17% 70%virtually 51%person 66% 40% 43% Not selling 49% +15%Net change +2%Net change 40% Time reps spend selling vs. 11% not selling in an average week Cross-Team Collaboration Data analysis of propensity to buy Data-driven insights Intuition A fairly even mix Other Gut feeling, intuition, educated guess Sales teams that share common goals and metrics with: Marketing 80% Service 75% * Base: Sales executives and managers ** Base: Sales executives, managers, and reps Salesforce Research
Country Profile State of Sales 38 Singapore (191 Sales Professionals) Top Sales Metrics Top Sales Technologies Top KPIs currently tracked by sales teams* Top technologies currently used by sales teams 67% 65% 59% 65% 62% 58% Team quota met Individual quota met Conversion rate Sales reporting/analytics Customer relationship management Sales forecasting tools (CRM) system Top KPIs for anticipated growth over the next two years* Top technologies for anticipated growth over the next two years* Customer Customer Net Promoter tificial ospecting Marketing lifetime value acquisition cost Ar Sales pr +135%(CLV) +123%(CAC) +118%Score (NPS) +216%intelligence +131%tools +131%automation Rep Quota Attainment Artificial Intelligence Use 68%of sales reps expect to miss their annual quota this year 24%of sales teams currently use artificial intelligence Rep Time Allocation Data-Driven Sales Reps have increased time spent engaging with customers/ Sales teams primarily prioritize leads based on:** Sales teams primarily forecast sales based on: prospects in the following ways over the past three years: 35% 12% Connecting Meeting in Selling 75%virtually 41%person 65% 40% 40% 44% Not selling +17%Net change +5%Net change 45% Time reps spend selling vs. 20% not selling in an average week Cross-Team Collaboration Data analysis of propensity to buy Data-driven insights Intuition A fairly even mix Other Gut feeling, intuition, educated guess Sales teams that share common goals and metrics with: Marketing 76% Service 70% * Base: Sales executives and managers ** Base: Sales executives, managers, and reps Salesforce Research
Industry Profiles Salesforce Research
Industry Profile State of Sales 40 Retail and Consumer Goods (900 Sales Professionals) Top Sales Metrics Top Sales Technologies Top KPIs currently tracked by sales teams* Top technologies currently used by sales teams 67% 62% 61% 68% 65% 61% Customer satisfaction (CSAT) eam quota met Individual quota met Sales reporting/analytics Account and contact management Sales forecasting tools T Top KPIs for anticipated growth over the next two years* Top technologies for anticipated growth over the next two years* Configure- Net Promoter Customer lifetime Pipeline Artificial Opportunity price-quote +129%Score (NPS) +105%value (CLV) +100%accuracy +135%intelligence +106%management +103%(CPQ) solution Rep Quota Attainment Artificial Intelligence Use 63%of sales reps expect to miss their annual quota this year 25%of sales teams currently use artificial intelligence Rep Time Allocation Data-Driven Sales Reps have increased time spent engaging with customers/ Sales teams primarily prioritize leads based on:** Sales teams primarily forecast sales based on: prospects in the following ways over the past three years: 35% Connecting Meeting in Selling 17% 64%virtually 52%person 65% 36% Not selling 49% 51% +10%Net change +6%Net change 32% Time reps spend selling vs. 15% not selling in an average week Cross-Team Collaboration Data analysis of propensity to buy Data-driven insights Intuition A fairly even mix Other Gut feeling, intuition, educated guess Sales teams that share common goals and metrics with: Marketing 81% Service 80% * Base: Sales executives and managers ** Base: Sales executives, managers, and reps Salesforce Research
Industry Profile State of Sales 41 Financial Services (336 Sales Professionals) Top Sales Metrics Top Sales Technologies Top KPIs currently tracked by sales teams* Top technologies currently used by sales teams 67% 62% 55% 68% 65% 62% Team quota met Customer satisfaction (CSAT) & Conversion rate Sales reporting/analytics Customer relationship management Account and contact management individual quota met & customer (CRM) system retention/attrition Top KPIs for anticipated growth over the next two years* Top technologies for anticipated growth over the next two years* Pipeline Customer usage Partner relationship Net Promoter (e.g., consumption, Artificial management (PRM) Marketing +91%Score (NPS) +89%accuracy +73%deployment, utilization) +120%intelligence +98%solution +71%automation Rep Quota Attainment Artificial Intelligence Use 50%of sales reps expect to miss their annual quota this year 31%of sales teams currently use artificial intelligence Rep Time Allocation Data-Driven Sales Reps have increased time spent engaging with customers/ Sales teams primarily prioritize leads based on:** Sales teams primarily forecast sales based on: prospects in the following ways over the past three years: 32% Connecting Meeting in Selling 13% 61%virtually 53%person 68% 33% Not selling 54% 34% 54% +10%Net change +5%Net change 13% Time reps spend selling vs. not selling in an average week Cross-Team Collaboration Data analysis of propensity to buy Data-driven insights Intuition A fairly even mix Other Gut feeling, intuition, educated guess Sales teams that share common goals and metrics with: Marketing 76% Service 70% * Base: Sales executives and managers ** Base: Sales executives, managers, and reps Salesforce Research
Industry Profile State of Sales 42 Manufacturing (321 Sales Professionals) Top Sales Metrics Top Sales Technologies Top KPIs currently tracked by sales teams* Top technologies currently used by sales teams 71% 69% 63% 68% 62% 56% Individual quota met Team quota met Customer satisfaction (CSAT) Sales reporting/analytics Account and contact management Customer relationship management (CRM) system Top KPIs for anticipated growth over the next two years* Top technologies for anticipated growth over the next two years* Partner relationship Customer lifetime Pipeline Net Promoter Artificial Marketing auto- management (PRM) +112%value (CLV) +111%accuracy +94%Score (NPS) +248%intelligence +176%mation +110%solution Rep Quota Attainment Artificial Intelligence Use 59%of sales reps expect to miss their annual quota this year 18%of sales teams currently use artificial intelligence Rep Time Allocation Data-Driven Sales Reps have increased time spent engaging with customers/ Sales teams primarily prioritize leads based on:** Sales teams primarily forecast sales based on: prospects in the following ways over the past three years: 37% Connecting Meeting in Selling 19% 63%virtually 44%person 63% 32% Not selling 51% 46% +13%Net change +1%Net change 17% 35% Time reps spend selling vs. not selling in an average week Cross-Team Collaboration Data analysis of propensity to buy Data-driven insights Intuition A fairly even mix Other Gut feeling, intuition, educated guess Sales teams that share common goals and metrics with: Marketing 75% Service 69% * Base: Sales executives and managers ** Base: Sales executives, managers, and reps Salesforce Research
Industry Profile State of Sales 43 Healthcare and Life Sciences (161 Sales Professionals) Top Sales Metrics Top Sales Technologies Top KPIs currently tracked by sales teams* Top technologies currently used by sales teams 71% 69% 65% 66% 63% 61% Individual quota met stomer satisfaction (CSAT) Sales reporting/analytics Customer relationship management Team quota met Cu Account and contact management (CRM) system Top KPIs for anticipated growth over the next two years* Top technologies for anticipated growth over the next two years* Configure- Pipeline Net Promoter Customer lifetime Artificial Sales process price-quote +125%accuracy +115%Score (NPS) +91%value (CLV) +221%intelligence +114%automation +104%(CPQ) solution Rep Quota Attainment Artificial Intelligence Use 56%of sales reps expect to miss their annual quota this year 21%of sales teams currently use artificial intelligence Rep Time Allocation Data-Driven Sales Reps have increased time spent engaging with customers/ Sales teams primarily prioritize leads based on:** Sales teams primarily forecast sales based on: prospects in the following ways over the past three years: 33% Connecting Meeting in Selling 16% 59%virtually 46%person 67% 35% Not selling 52% 30% 54% +14%Net change +4%Net change 14% Time reps spend selling vs. not selling in an average week Cross-Team Collaboration Data analysis of propensity to buy Data-driven insights Intuition A fairly even mix Other Gut feeling, intuition, educated guess Sales teams that share common goals and metrics with: Marketing 73% Service 70% * Base: Sales executives and managers ** Base: Sales executives, managers, and reps Salesforce Research
Industry Profile State of Sales 44 Telecommunications and Media (135 Sales Professionals) Top Sales Metrics Top Sales Technologies Top KPIs currently tracked by sales teams* Top technologies currently used by sales teams 71% 62% 60% 72% 65% 59% Customer satisfaction (CSAT) Individual quota met & Conversion rate Sales reporting/analytics ccount and contact management Customer relationship management A customer usage (e.g., consumption, (CRM) system deployment, utilization) Top KPIs for anticipated growth over the next two years* Top technologies for anticipated growth over the next two years* Configure- Customer lifetime Net Promoter Pipeline Sales process Marketing auto- price-quote +150%value (CLV) +125%Score (NPS) +106%accuracy +147%automation +131%mation +121%(CPQ) solution Rep Quota Attainment Artificial Intelligence Use 52%of sales reps expect to miss their annual quota this year 31%of sales teams currently use artificial intelligence Rep Time Allocation Data-Driven Sales Reps have increased time spent engaging with customers/ Sales teams primarily prioritize leads based on:** Sales teams primarily forecast sales based on: prospects in the following ways over the past three years: 31% 12% Connecting Meeting in Selling 26% 50%virtually 48%person 69% Not selling 54% 36% 53% +11%Net change +5%Net change 20% Time reps spend selling vs. not selling in an average week Cross-Team Collaboration Data analysis of propensity to buy Data-driven insights Intuition A fairly even mix Other Gut feeling, intuition, educated guess Sales teams that share common goals and metrics with: Marketing 80% Service 76% * Base: Sales executives and managers ** Base: Sales executives, managers, and reps Salesforce Research
Appendix Salesforce Research
State of Sales 46 Appendix Percentage of Sales Teams That Use the Following Technologies High Moderate Under- High Performers vs. Performers Performers performers Underperformers Sales reporting/analytics 68% 68% 69% 58% 1.2x more likely Account and contact management 65% 67% 64% 57% 1.2x more likely Customer relationship management (CRM) system 58% 62% 59% 42% 1.5x more likely Sales forecasting tools 56% 62% 56% 40% 1.6x more likely Sales coaching and training solution 54% 60% 54% 43% 1.4x more likely Email/CRM integration 51% 60% 50% 32% 1.8x more likely Compensation/incentive management 49% 56% 48% 35% 1.6x more likely Sales prospecting tools 47% 57% 46% 30% 1.9x more likely Competitive intelligence 47% 55% 45% 42% 1.3x more likely Mobile sales apps for employees 46% 57% 44% 30% 1.9x more likely Customer insight tool 45% 52% 44% 31% 1.6x more likely Opportunity management 43% 51% 42% 29% 1.8x more likely Sales process automation 42% 53% 41% 23% 2.3x more likely Configure-price-quote (CPQ) solution 40% 49% 39% 24% 2.1x more likely Partner relationship management (PRM) solution 37% 44% 36% 20% 2.2x more likely Marketing automation 35% 45% 33% 16% 2.8x more likely Artificial intelligence 24% 36% 21% 7% 4.9x more likely Base: All respondents Salesforce Research
State of Sales 47 Appendix Percentage of Sales Teams That Used the Following Technologies 2016–2018 in 2016 Versus Those Using Them Today Growth Sales reporting/analytics** 68% +25% 54% Account and contact management 65% +6% 61% Customer relationship management (CRM) system*** 58% N/A N/A Sales forecasting tools 56% +18% 47% Sales coaching and training solution** 54% +28% 43% Email/CRM integration*** 51% N/A N/A Compensation/incentive management** 49% +30% 50% Sales prospecting tools 47% +30% 36% Competitive intelligence 47% -1% 36% Mobile sales apps for employees 46% +61% 29% Customer insight tool** 45% +22% 37% Opportunity management 43% +9% 40% 42% Currently use Used in 2016* Sales process automation** 36% +18% Configure-price-quote (CPQ) solution 40% -2% * Source: State of Sales survey, Salesforce Research, August 2016. 41% Data may or may not be represented in the second annual 37% “State of Sales” report. Partner relationship management (PRM) solution*** N/A N/A ** Some technologies were phrased slightly differently in the 2016 survey. Marketing automation 35% +17% *** Technology was not included in the 2016 survey. 30% Growth rates calculated using the following: Artificial intelligence** 24% +11% (currently use – used in 2016)/(used in 2016) 22% Base: All respondents Salesforce Research
State of Sales 48 Appendix Percentage of Sales Teams That Use or Plan to Use the Following Technologies 2018–2020 Growth (projected) Sales reporting/analytics 67% 22% +32% Account and contact management 64% 22% +35% Customer relationship management (CRM) system 57% 25% +43% Sales forecasting tools 54% 26% +49% Sales coaching and training solution 51% 29% +56% Email/CRM integration 49% 28% +56% Compensation/incentive management 46% 27% +58% Competitive intelligence 45% 31% +68% Sales prospecting tools 45% 31% +69% Mobile sales apps for employees 44% 31% +70% Customer insight tool 43% 34% +79% Opportunity management 41% 33% +80% Sales process automation 38% 33% +86% Configure-price-quote (CPQ) solution 37% 31% +82% Partner relationship management (PRM) solution 34% 32% +95% Currently use Plan to use by 2020 Marketing automation 32% 33% +104% Base: Sales executives and managers Artificial intelligence 21% 33% +155% Growth rates calculated using the following: (plan to use by 2020)/(currently use) Salesforce Research
State of Sales 49 Appendix High Moderate Under- High Performers vs. Percentage of Sales Reps Who Have the Following Capabilities Performers Performers performers Underperformers Collaboration tools (e.g., internal social networks, instant messaging) 57% 58% 58% 47% 1.3x more likely Market intelligence on customers/prospects 51% 53% 52% 36% 1.5x more likely Mobile sales capabilities (i.e., access and edit customer, account, and opportunity information from a mobile device) 50% 52% 46% 24% 2.2x more likely Fully integrated systems (i.e., linked data sources) 50% 55% 50% 29% 1.9x more likely Data insights on customers’ propensity to buy 46% 49% 51% 41% 1.2x more likely Offline data access (i.e., access and edit customer, account, and opportunity information without an internet connection) 39% 34% 42% 29% 1.2x more likely Automated surfacing of leads/ opportunities most likely to close 39% 42% 39% 19% 2.2x more likely Suggested next steps on an opportunity 37% 44% 35% 21% 2.1x more likely Alerts to key actions required on an opportunity 34% 35% 35% 12% 2.9x more likely Base: Sales representatives Salesforce Research
State of Sales 50 Appendix High Moderate Under- High Performers vs. Percentage of Sales Leaders Who Have the Following Capabilities Performers Performers performers Underperformers Performance insights on individual reps 60% 63% 58% 65% — Data insights on team performance patterns 52% 55% 53% 41% 1.4x more likely Fully integrated systems (i.e., linked data sources) 49% 62% 47% 27% 2.3x more likely Data insights on book of business that provide guidance on targeting 44% 52% 43% 31% 1.7x more likely Automated identification of team resources needed (e.g., overlays, support, etc.) 35% 47% 33% 20% 2.3x more likely Intelligent forecasting 34% 40% 33% 17% 2.3x more likely Base: Sales executives and managers Salesforce Research
State of Sales 51 Appendix Percentage of Salespeople with a CRM Who View It as Important and Agree with the Following Statements About the Technology Connects data across departments 84% Helps me understand what happens across my deals 83% Makes it easy to find the right information at the right time 83% Streamlines processes 81% Provides insights and information I wouldn’t know otherwise 79% Connects me with my sales peers 77% Automates data entry 75% Percentage of Salespeople with a CRM Who View It as Unimportant or Neutral and Agree with the Following Statements About the Technology Feels like busy work 58% Isn’t where my actual work happens 57% Isn’t where other departments’ work happens 57% Makes it difficult to find the right information at the right time 55% Doesn’t provide valuable insights/reports 54% Is difficult to use 52% Is often broken or doesn’t work properly 47% Base: Respondents with a CRM system Salesforce Research
State of Sales 52 Appendix Sales Reps’ Perception of Their Time Spent on the Following Aspects of an Opportunity Managing emails 62% 30% 7% Logging activities (e.g., emails, phone calls) 58% 34% 8% Inputting sales data and customer notes 56% 36% 8% Finding the right person to contact 50% 39% 11% Creating follow-up tasks 48% 40% 12% Generating quotes/proposals and gaining approvals 46% 43% 11% Researching competitive offerings 44% 36% 20% Discovering a customer’s/prospect’s needs 44% 41% 15% Researching a customer’s/prospect’s current solution 44% 42% 14% Reviewing pipeline 43% 42% 15% Prioritizing leads/opportunities 42% 45% 13% Researching competitive activity 40% 40% 21% Too much About the right amount Too little Base: Sales representatives Salesforce Research
State of Sales 53 Appendix High Moderate Under- High Performers vs. Percentage of Salespeople Who Are Confident of the Following Performers Performers performers Underperformers Industry knowledge 80% 84% 79% 68% 1.2x more likely Customer’s/prospect’s business needs 77% 85% 77% 57% 1.5x more likely People involved in decision-making 76% 86% 75% 58% 1.5x more likely Customer’s/prospect’s entire relationship with our company (e.g., marketing and service interactions) 74% 83% 73% 52% 1.6x more likely Executive priorities 67% 76% 66% 39% 2.0x more likely Competitive bids 66% 77% 65% 42% 1.8x more likely Approved budget 65% 79% 63% 35% 2.2x more likely Customer/prospect intelligence beyond LinkedIn profiles (e.g., personal interests) 61% 76% 59% 34% 2.2x more likely Base: Sales representatives, executives, and managers Salesforce Research
State of Sales 54 Appendix Percentage of Salespeople Whose Leads and Opportunities High Moderate Under- Are Primarily Prioritized Based on the Following Performers Performers performers Data analysis of propensity to buy 33% 35% 34% 22% Intuition 16% 12% 17% 24% Geography 14% 13% 14% 13% Company size 13% 14% 13% 17% Job title 7% 9% 6% 6% Last in/first out 5% 6% 5% 3% Alphabetically 5% 5% 5% 6% None of the above (I don’t prioritize leads) 6% 6% 5% 8% Base: Sales representatives, executives, and managers High Moderate Under- Percentage of Sales Teams Whose Forecasts Are Primarily Based on the Following Performers Performers performers Date-driven insights 50% 55% 49% 38% A fairly even mix 34% 31% 35% 38% Gut feeling, intuition, and educated guess 16% 15% 16% 25% Base: All respondents Salesforce Research
Survey Demographics Salesforce Research
Survey Demographics State of Sales 56 * Industry Company Size Sales Primary Area of Focus Retail .......................................................................21% Small (1–100 employees) .................................27% Inside sales ............................................................52% Manufacturing ......................................................11% Medium (101–3,500 employees) ...................57% Outside/field sales ...............................................41% Consumer products ............................................10% Enterprise (3,501+ employees) ........................15% Channel/partner sales .......................................... 6% Technology .............................................................. 7% Automotive .............................................................. 6% Generation Country Professional services .............................................. 6% Banking ..................................................................... 6% Engineering, architecture, Baby Boomers/Traditionalists United States .........................................................17% construction, real estate ....................................... 6% (born before 1964)..............................................15% Germany ................................................................11% Insurance ................................................................. 5% Gen Xers (born 1965–1980) ............................48% Australia/New Zealand .......................................10% Hospitality, travel, transportation......................... 4% Millennials/Gen Zers (born 1981–1999).......37% Canada ...................................................................10% Healthcare (provider) ............................................ 3% France .....................................................................10% Communications ................................................... 3% Role Within Sales Japan ......................................................................10% Education ................................................................. 2% United Kingdom/Ireland ....................................10% Energy ....................................................................... 2% Netherlands ............................................................. 8% Media and entertainment .................................... 2% Owner ....................................................................... 4% Singapore ................................................................. 7% Life sciences and biotechnology ......................... 2% President or CEO .................................................... 2% Hong Kong ............................................................... 6% Agriculture and mining ......................................... 1% C-level executive Capital markets ....................................................... 1% (CIO, CTO, COO, CMO, etc.) ................................ 3% Region Recreation and sports ........................................... 1% Sales vice president................................................ 8% Wealth management ............................................ 1% Sales manager or director ..................................32% Other ......................................................................... 3% Sales representative .............................................31% EMEA ......................................................................40% Sales support ........................................................... 7% APAC .......................................................................33% Sales trainer, coach, or equivalent ...................... 2% NAM ........................................................................28% Company Type Sales operations ..................................................... 9% Business-to-business (B2B) ................................32% Business-to-consumer (B2C) .............................38% Business-to-business-to-consumer (B2B2C) ..................................................................31% * Base: Sales representatives, managers, and support SalesforSalesforcce Re Researesearchch
Want more sales tips and wisdom? State of Sales 57 Quotable Story of Sales Salesforce Research
Browse all reports at salesforce.com/research.