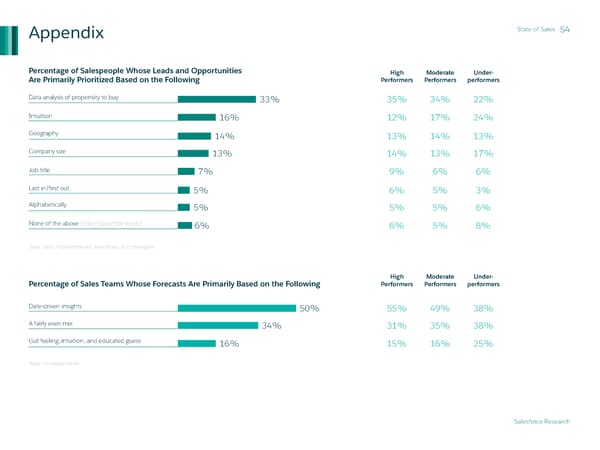
State of Sales 54 Appendix Percentage of Salespeople Whose Leads and Opportunities High Moderate Under- Are Primarily Prioritized Based on the Following Performers Performers performers Data analysis of propensity to buy 33% 35% 34% 22% Intuition 16% 12% 17% 24% Geography 14% 13% 14% 13% Company size 13% 14% 13% 17% Job title 7% 9% 6% 6% Last in/first out 5% 6% 5% 3% Alphabetically 5% 5% 5% 6% None of the above (I don’t prioritize leads) 6% 6% 5% 8% Base: Sales representatives, executives, and managers High Moderate Under- Percentage of Sales Teams Whose Forecasts Are Primarily Based on the Following Performers Performers performers Date-driven insights 50% 55% 49% 38% A fairly even mix 34% 31% 35% 38% Gut feeling, intuition, and educated guess 16% 15% 16% 25% Base: All respondents Salesforce Research
 State of Sales Page 53 Page 55