State of Marketing | Ninth Edition
The latest trends on AI, data, and personalization with insights from nearly 5,00 marketers worldwide.
NINTH EDITION State of Marketing The latest trends on AI, data, and personalization with insights from nearly 5,000 marketers worldwide.
TH SALESFORCE STATE OF MARKETING, 9 EDITION 2 Foreword We're in a new wave of the artificial intelligence revolution — catalyzed by the generative AI gold rush — and marketers are leading the charge by A note to marketers embracing rapid advancements in the technology to better connect with from Salesforce's CMO customers and prospects. But AI isn't just marketers' biggest priority. It's also their biggest challenge. A strong data foundation is critical to AI success for marketers as they work to bring together customer data for real-time activation. That’s what we found in our ninth State of Marketing report, which surveyed marketing leaders worldwide to understand the biggest trends, priorities, and challenges affecting marketers today. To help navigate a rapidly evolving landscape, the report also uncovers: • How marketing budgets address technological needs • Where marketers pull data to deepen customer understanding and power AI engines • The most common ways marketers incorporate predictive and generative AI into their work streams — and some of the biggest concerns they have about getting it right. I hope you find this report a helpful guide to navigating this new era of marketing. Ariel Kelman President & Chief Marketing Officer Salesforce
TH SALESFORCE STATE OF MARKETING, 9 EDITION 3 What You’ll Find in This Report For the ninth edition of our "State of Marketing" report, Salesforce surveyed nearly 5,000 marketers worldwide to discover how marketers: • Evaluate the rise of artificial intelligence (AI) and implementing it in their operations • Approach their data acquisition, maintenance, and application strategies • Ensure customer trust and security as vulnerabilities increase Unless cited otherwise, data in this report is from a double-anonymous survey conducted from February 5th to March 12th, 2024. The survey generated 4,850 responses from marketing decision makers across North America, 4,850 marketers Latin America, Asia-Pacific, and Europe. See page surveyed worldwide 33 for further survey demographics. Due to rounding, not all percentage totals in this report equal 100%. Comparison calculations are made from total (not rounded) numbers. Salesforce Research provides data-driven insights to help businesses transform how they drive customer success. Browse all reports at salesforce.com/research.
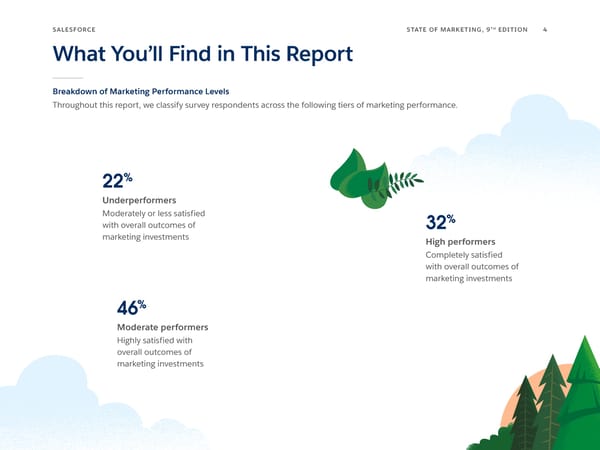
TH SALESFORCE STATE OF MARKETING, 9 EDITION 4 What You’ll Find in This Report Breakdown of Marketing Performance Levels Throughout this report, we classify survey respondents across the following tiers of marketing performance. % 22 Underperformers Moderately or less satisfied % with overall outcomes of 32 marketing investments High performers Completely satisfied with overall outcomes of marketing investments % 46 Moderate performers Highly satisfied with overall outcomes of marketing investments
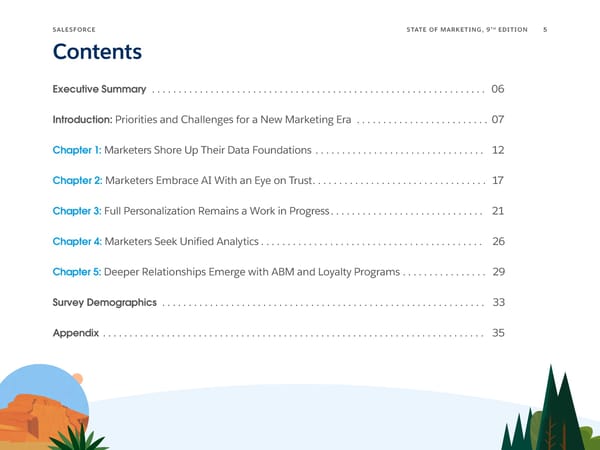
TH SALESFORCE STATE OF MARKETING, 9 EDITION 5 Contents Executive Summary ............................................................... 06 Introduction: Priorities and Challenges for a New Marketing Era ......................... 07 Chapter 1: Marketers Shore Up Their Data Foundations ................................ 12 Chapter 2: Marketers Embrace AI With an Eye on Trust................................. 17 Chapter 3: Full Personalization Remains a Work in Progress ............................. 21 Chapter 4: Marketers Seek Unified Analytics .......................................... 26 Chapter 5: Deeper Relationships Emerge with ABM and Loyalty Programs ................ 29 Survey Demographics ............................................................. 33 Appendix ........................................................................ 35
TH SALESFORCE STATE OF MARKETING, 9 EDITION 6 Executive Summary Introduction: Priorities and Challenges for a New Marketing Era Marketers are evolving their practices in a highly competitive landscape. They’re looking to AI — both generative and predictive — to help personalize at scale and boost efficiency. Marketers rank AI adoption as both their number one priority and challenge. 01 Marketers Shore Up Their Data Foundations Businesses have long struggled to connect disparate data points to create consistent, personalized experiences across customer journeys. Yet as third-party cookies are depreciated and AI proliferates, that quest is only becoming more critical — and challenging. Only 31% of marketers are fully satisfied with their ability to unify customer data sources. 02 Marketers Embrace AI With an Eye on Trust Marketers are intent on successfully applying AI in their operations with the right data, but are concerned about security and customer trust as adoption ramps up. Thirty-two percent of marketing organizations have fully implemented AI in their workflows, and an additional 43% are experimenting with it. 03 Full Personalization Remains a Work in Progress What constitutes a “personalized experience” continues to mature, and there’s a stark difference between how the highest- and lowest-performing marketing teams adapt. On average, high performers fully personalize across six channels, compared with underperformers who fully personalize across three. 04 Marketers Seek Unified Analytics There is no shortage of data sources, but putting that data to work is a challenge. Only 48% of marketers track customer lifetime value (CLV). 05 Deeper Relationships Emerge With ABM and Loyalty Programs Companies are increasingly turning to strategies like account-based marketing (ABM) and loyalty programs for better customer acquisition and retention. Yet many of these program's information sources remain disjointed, and so is the resulting customer experience. Thirty-nine percent of marketers say loyalty program functionalities are accessible across all touchpoints.
TH SALESFORCE RESEARCH STATE OF MARKETING, 9 EDITION 7 Introduction Priorities & Challenges 1 2 Priorities and 3 4 Challenges 5 for a New Marketing Era
TH SALESFORCE STATE OF MARKETING, 9 EDITION 8 AI Tops Marketing’s Agenda AI Is Marketers’ Main Focus — and Biggest Headache Marketers are at the start of a renaissance. The spark? Advancements in data and AI technologies prompting them to rethink, Marketers’ Top Priorities reconfigure, and revolutionize how 1 Implementing or leveraging AI companies connect with customers. 2 Improving our use of tools and technologies Taking advantage of AI is marketers' biggest priority — and biggest challenge. 3 Improving marketing ROI/attribution Maintaining trust, another key area of 4 Engaging with customers in real time focus, is a core part of successful AI deployment. In fact, 68% of customers 5 Building/retaining trust with customers say advances in AI make it more important for companies to be trustworthy.* Marketers’ Top Challenges In addition to ramping up new or 1 Difficulties implementing or leveraging AI maturing technologies like AI, marketers are focusing on better use of their 2 Engaging with customers in real time existing toolsets. CMOs, often pressed 3 Building/retaining trust with customers to maintain or exceed performance with fewer resources, may see optimizing their 4 Measuring marketing ROI/attribution current tech stack as a promising solution. 5 Creating a cohesive customer journey *Salesforce State of the Connected Customer, August 2023.
TH SALESFORCE STATE OF MARKETING, 9 EDITION 9 Marketers Wield a Variety of Tools To Spur Growth Marketers Use Diverse Tools To Fine-Tune Outreach and Measure Success Marketing organizations have a broad remit spanning brand-building to revenue generation. In turn, they Marketing Tools and Technologies Used rely on a wide set of tools to keep up. Marketing analytics/ measurement tools 88% Marketers use an average Customer relationship of 8 different marketing management system 86% tools and technologies. Advertising platforms 80% The popularity of analytics/ measurement tools and customer Mobile marketing 78% relationship management systems Marketing automation/ 78% shows an emphasis on data-driven journey management approaches and fostering better Email service provider 78% customer engagement. However, many marketers use additional tools Content 73% to capture, unify, and activate data management system from across the customer journey in Customer 72% more refined ways. data platform Personalization engine 71% Account based 70% marketing platform* *Base: B2B and B2B2C marketers
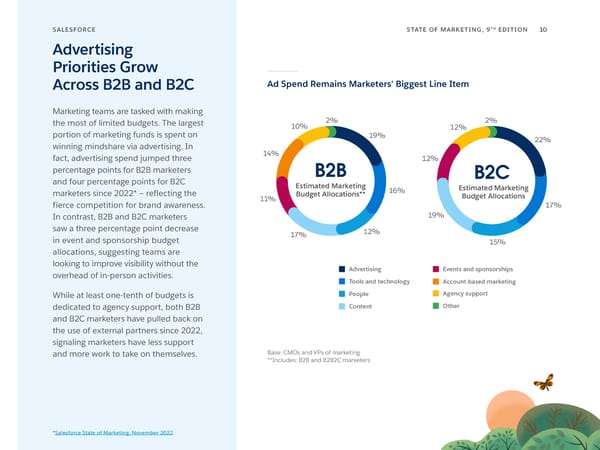
TH SALESFORCE STATE OF MARKETING, 9 EDITION 10 Advertising Priorities Grow Across B2B and B2C Ad Spend Remains Marketers' Biggest Line Item Marketing teams are tasked with making the most of limited budgets. The largest 10% 2% 2% 12% portion of marketing funds is spent on 19% 22% winning mindshare via advertising. In fact, advertising spend jumped three 14% 12% percentage points for B2B marketers B2B B2C and four percentage points for B2C Estimated Marketing Estimated Marketing marketers since 2022* — reflecting the Budget Allocations** 16% Budget Allocations fierce competition for brand awareness. 11% 17% In contrast, B2B and B2C marketers 19% saw a three percentage point decrease 17% 12% in event and sponsorship budget 15% allocations, suggesting teams are looking to improve visibility without the Advertising Events and sponsorships overhead of in-person activities. Tools and technology Account-based marketing While at least one-tenth of budgets is People Agency support dedicated to agency support, both B2B Content Other and B2C marketers have pulled back on the use of external partners since 2022, signaling marketers have less support and more work to take on themselves. Base: CMOs and VPs of marketing **Includes: B2B and B2B2C marketers *Salesforce State of Marketing, November 2022
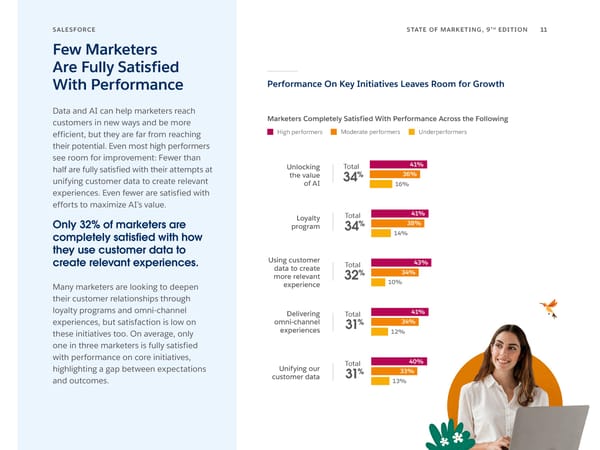
TH SALESFORCE STATE OF MARKETING, 9 EDITION 11 Few Marketers Are Fully Satisfied With Performance Performance On Key Initiatives Leaves Room for Growth Data and AI can help marketers reach customers in new ways and be more Marketers Completely Satisfied With Performance Across the Following efficient, but they are far from reaching High performers Moderate performers Underperformers their potential. Even most high performers see room for improvement: Fewer than half are fully satisfied with their attempts at Unlocking Total 41% the value % 36% unifying customer data to create relevant of AI 34 16% experiences. Even fewer are satisfied with efforts to maximize AI’s value. Loyalty Total 41% Only 32% of marketers are program % 38% 34 14% completely satisfied with how they use customer data to create relevant experiences. Using customer Total 43% data to create % 34% more relevant 32 10% Many marketers are looking to deepen experience their customer relationships through loyalty programs and omni-channel Delivering Total 41% experiences, but satisfaction is low on omni-channel % 34% experiences 31 12% these initiatives too. On average, only one in three marketers is fully satisfied with performance on core initiatives, Total 40% highlighting a gap between expectations Unifying our % 33% and outcomes. customer data 31 13%
TH SALESFORCE RESEARCH STATE OF MARKETING, 9 EDITION 12 01 Marketers Shore Up Their Data Foundations
TH SALESFORCE STATE OF MARKETING, 9 EDITION 13 01 Marketers Use Mix of Tactics To Deepen Audience Understanding Marketers Use a Wide Array of Strategies To Capture Data With every click and conversation, customers Marketing Tactics Used and prospects leave behind a trail of digital breadcrumbs. Eager to make the most of Customer service data 88% every interaction, marketers deploy a wide variety of tactics to collect clues for better Transaction data 82% audience understanding. Marketers use an average of 9 Mobile apps 82% different tactics across the entire Web registration/ 82% customer journey. account creation Loyalty programs 80% Ever the innovators, marketers are branching out from the most popular tactics — leveraging Subscriptions 75% customer service and commerce data that falls (e.g., newsletter) outside of their traditional purview. This suggests Online learning 72% marketers are patching together a connected platform view of their customers and taking a full-funnel Access to discounts 71% approach to data. Interactive tools 68% (e.g., quizzes, calculators) Cause-based marketing 62% (e.g., Box Tops for Education) Digital tokens 50% (e.g., NFTs) Gated content (e.g., research, 43% webinars, e-books)
TH SALESFORCE STATE OF MARKETING, 9 EDITION 14 01 Trusted Customer Data Takes Center Stage A Detailed View of the Customer is the Clear Priority With the end of third-party cookies near, marketers, publishers, and advertisers are Customer Data Sources Used by Marketers increasingly looking to first-party data (both known and anonymous) to understand Customer insight data their audience. (e.g., propensity to buy/churn,product 84% interest score, customer lifetime value) Customer insight data and transactional data First party data also help provide a deeper look at what the (i.e., data collected directly by a 84% company from its audience, audience wants and needs. These sources are including channel engagement data) also first-party data in all but name,as they’re Transactional data 84% gleaned directly from customer activity with (e.g., purchase history) the business. Known digital identities 78% 38% of marketers don't use (e.g., email addresses, social IDs) third-party data. Second-party data (i.e., devices and cookies from 70% a direct relationship with While on the decline, 61% of marketers another marketer or publisher) still use third-party data, compared to 75% Offline identities in 2022.* This downward trend shows that (e.g., postal address, 69% there is more work to be done for marketers phone number, age, gender) to wean themselves off this increasingly Anonymized digital identities devalued source of information. (e.g., cookies, device IDs, 68% website behavior, location data) Third-party data (i.e., devices and cookies from 61% an aggregator or data broker such as Acxiom, Nielsen, or Neustar) Non-transactional data 44% (e.g., customer service interactions, lead-scoring data) *Salesforce State of Marketing, November 2022
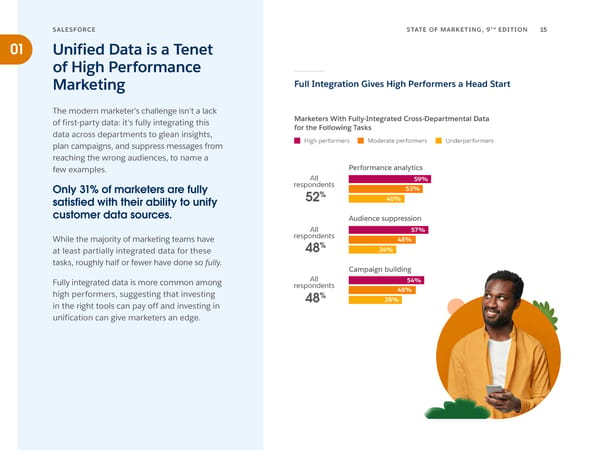
TH SALESFORCE STATE OF MARKETING, 9 EDITION 15 01 Unified Data is a Tenet of High Performance Marketing Full Integration Gives High Performers a Head Start The modern marketer's challenge isn't a lack of first-party data: it's fully integrating this Marketers With Fully-Integrated Cross-Departmental Data data across departments to glean insights, for the Following Tasks plan campaigns, and suppress messages from High performers Moderate performers Underperformers reaching the wrong audiences, to name a few examples. Performance analytics All 59% Only 31% of marketers are fully respondents 53% satisfied with their ability to unify 52% 40% customer data sources. Audience suppression All 57% While the majority of marketing teams have respondents 48% % 34% at least partially integrated data for these 48 tasks, roughly half or fewer have done so fully. Campaign building Fully integrated data is more common among All 54% respondents 48% high performers, suggesting that investing % 38% in the right tools can pay off and investing in 48 unification can give marketers an edge.
TH SALESFORCE STATE OF MARKETING, 9 EDITION 16 01 Most Marketers Still Need Help Acting on Data Data Goes Real-Time, but Access Can Be a Barrier Marketers are under pressure to make sense of and apply the information they collect about Speed of Data Availability for the Following Activities prospects and customers — and fast. Timeliness In real time/live Delayed Data not available has become a major emphasis. How long does Getting performance it take for a platform to update its data, and analytics 59% 37% 4% how quickly can marketers act on it? Executing a campaign 57% 38% 4% About two in five marketers still don’t have Segmenting an real-time data at their disposal for crucial tasks, audience 52% 42% 4% relying instead on potentially outdated insights — or even intuition. Even teams with live data are slowed down by their ability to activate it. Tasks Marketers Can Generally Do On Their Own vs. Need Assistance Case in point: while over half of marketers Generally can do it on my own Generally need technical assistance say data is available in real time to execute a campaign, 59% need the IT department’s Segment an 40% 59% help to do so. This could hint at a lack of tools audience needed to quickly unearth real-time data, or Execute a 41% 59% campaign a shortage of expertise and training necessary Get performance to use said tools. analytics 44% 56%
TH SALESFORCE RESEARCH STATE OF MARKETING, 9 EDITION 17 02 Customer Journey Map AI Journey Automation Marketers Create copy Embrace AI With an Eye on Trust
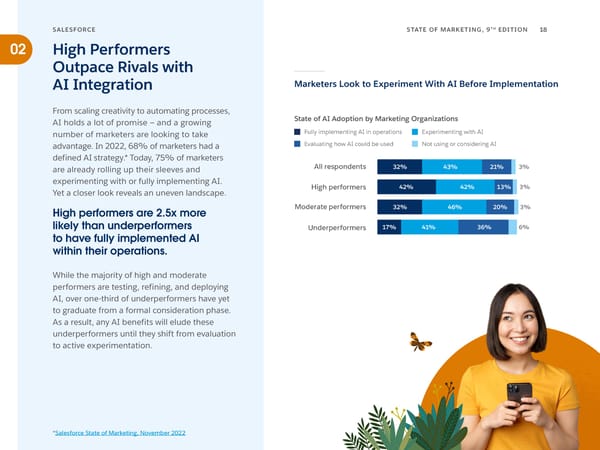
TH SALESFORCE STATE OF MARKETING, 9 EDITION 18 02 High Performers Outpace Rivals with AI Integration Marketers Look to Experiment With AI Before Implementation From scaling creativity to automating processes, AI holds a lot of promise — and a growing State of AI Adoption by Marketing Organizations number of marketers are looking to take Fully implementing AI in operations Experimenting with AI advantage. In 2022, 68% of marketers had a Evaluating how AI could be used Not using or considering AI defined AI strategy.* Today, 75% of marketers are already rolling up their sleeves and All respondents 32% 43% 21% 3% experimenting with or fully implementing AI. High performers 42% 42% 13% 3% Yet a closer look reveals an uneven landscape. High performers are 2.5x more Moderate performers 32% 46% 20% 3% likely than underperformers Underperformers 17% 41% 36% 6% to have fully implemented AI within their operations. While the majority of high and moderate performers are testing, refining, and deploying AI, over one-third of underperformers have yet to graduate from a formal consideration phase. As a result, any AI benefits will elude these underperformers until they shift from evaluation to active experimentation. *Salesforce State of Marketing, November 2022
TH SALESFORCE STATE OF MARKETING, 9 EDITION 19 02 AI Opens Possibilities For Next-Level Customer Experience Generative AI may be relatively new, but marketers have been quick to add it to their arsenal. Over half of marketers say they use predictive AI and even more cite using generative AI. This could reflect and the behind-the-scenes nature of predictive AI applications and the buzz surrounding the explosive growth and accessibility of generative AI since ChatGPT's release in late 2022. Already, generative AI use cases rank among marketers’ favorites alongside more established predictive AI applications. As a result, marketers are leaning on both flavors of AI to boost creativity, generate content, and do more with fewer resources. Marketers Lean on AI to Automate and Create Marketers' Plans to Use the Following AI Type Top Marketing AI Use Cases Have currently Piloting or planning to have within 18 months 1 Automating customer interactions No plans to have within 18 months Don't know 2 Generating content Predictive AI 54% 42% 3% 3 Analyzing performance Generative AI 63% 35% 3% 4 Automating data integration 5 Driving best offers in real time Base: Marketers who use AI
TH SALESFORCE STATE OF MARKETING, 9 EDITION 20 02 Marketers Have Broad Concerns About AI Data Tops the List of AI Concerns Inspired by generative AI’s use cases, marketers are eager to test the technology out for Ranking of Marketers' Generative AI Concerns themselves, particularly when compared to their 1 Data exposure or leakage peers. Eighty-eight percent of marketers worry 2 Lack of necessary data about missing out on generative AI’s benefits, compared to 78% of sales and 73% of service 3 Lack of strategy or use cases colleagues.* Yet marketers, especially at the executive level, have concerns about embracing 4 Inaccurate outputs the technology while protecting data integrity 5 Copyright or intellectual property concerns and job stability. 6 Distrust in generative AI 41% of CMOs cite data exposure as 7 Biased outputs a top concern compared to 29% of VPs and 32% of team leads. 8 Fear that AI will replace my job 9 Adherence to brand guidelines Ninety-eight percent of marketing leaders believe trustworthy data is essential.* But, just as the data 10 Difficulty learning how to use the technology must be trustworthy, so should its integration 11 Environmental impacts with AI. Generative AI systems require access to large datasets to learn, generate content, and create interactive experiences, underscoring the need to follow ethical and accurate guidelines while also taking steps to safeguard sensitive customer information. *Salesforce State of Data and Analytics, November 2023.
TH SALESFORCE RESEARCH STATE OF MARKETING, 9 EDITION 21 03 Customer Personalized Personlization Event Offer Email Activity Full Personalization Remains a Work in Progress
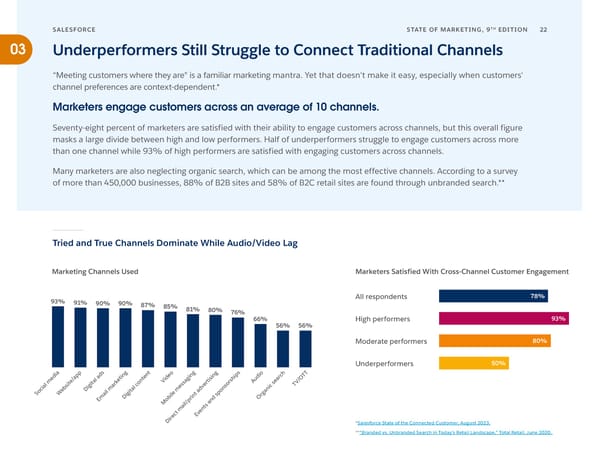
TH SALESFORCE STATE OF MARKETING, 9 EDITION 22 03 Underperformers Still Struggle to Connect Traditional Channels “Meeting customers where they are" is a familiar marketing mantra. Yet that doesn't make it easy, especially when customers' channel preferences are context-dependent.* Marketers engage customers across an average of 10 channels. Seventy-eight percent of marketers are satisfied with their ability to engage customers across channels, but this overall figure masks a large divide between high and low performers. Half of underperformers struggle to engage customers across more than one channel while 93% of high performers are satisfied with engaging customers across channels. Many marketers are also neglecting organic search, which can be among the most effective channels. According to a survey of more than 450,000 businesses, 88% of B2B sites and 58% of B2C retail sites are found through unbranded search.** Tried and True Channels Dominate While Audio/Video Lag Marketing Channels Used Marketers Satisfied With Cross-Channel Customer Engagement 93% All respondents 78% 91% 90% 90% 87% 85% 81% 80% 76% 66% High performers 93% 56% 56% Moderate performers 80% Underperformers 50% ia pp ds ng nt eo ng g ps o ch TT d ti e d sin i di O e e/a al a e Vi agi ti sh Au ear m it it k ont ss er or s TV/ s g ar c e v s ic b i l d cial e D m ta m on an o l e a p g S W ai gi l t Di i in s r Em ob pr nd O / M l a i s ma ent ct v ire E D *Salesforce State of the Connected Customer, August 2023. **“Branded vs. Unbranded Search in Today’s Retail Landscape,” Total Retail, June 2020.
TH SALESFORCE STATE OF MARKETING, 9 EDITION 23 Spotlight: Messaging Volume Grows, Retail and Consumer Albeit Unevenly, Year Over Year* Goods Marketers Boost Mobile Messaging Retail & Consumer Goods Marketing Message YoY Growth Email Growth Push, SMS, OTT Growth All Channel Growth Email remains by far the favorite when it 100% comes to number of messages sent, but retail and consumer goods marketers don't rely on that 75% channel alone.* With stiff competition for customers’ attention, marketers are investing in higher-growth 57% channels like mobile. 50% 39% While the amount of growth varies quarter-to-quarter, there is consistent upward movement in message 25% 15% sends across email, push notifications, SMS, and OTT. 15% 13% 9% 14% 14% 12% 9% 12% 8% 8% 10% 3% 81% of marketers say mobile 0% 2023 Q1 2023 Q2 2023 Q3 2023 Q4 2024 Q1 messaging will be a bigger priority in the coming year. The overall growth of mobile messaging has Share of Retail & Consumer Goods Marketing Message Sends dramatically outpaced email messaging growth Push, SMS, & OTT Email in two of the last five quarters. Q4 of 2023 saw 16% 18% 17% 14% 16% 17% 17% 17% 23% mobile’s growth rate reach more than 19 times 84% 82% 83% 86% 84% 83% 83% 83% that of email. 77% Given that the retail and consumer goods industry is often on the leading edge of marketing tactics, this could be a signal 2022 2022 2022 2022 2023 2023 2023 2023 2024 for what's to come for other industries. Q1 Q2 Q3 Q4 Q1 Q2 Q3 Q4 Q1 *Salesforce Shopping Index, April 2024.
TH SALESFORCE STATE OF MARKETING, 9 EDITION 24 03 Marketers Move to a Marketers Connect the Dots to Reach Their Audience Lifecycle Approach for Personalization Strategies Used for Personalization Support content for existing (e.g., how-to guides, 87% Creating a unique brand experience requires customers troubleshooting tips) ongoing, targeted engagement throughout Customer retention content the customer journey. This can be particularly for existing customers 85% challenging during early stages, when less (e.g., loyalty program invitations) customer data is available. Such constraints Personalized emails 84% could explain why marketers are more likely to personalize content for established customers than onboarding materials for newcomers. Personalized web pages 80% Over half of marketers provide all of the above, Personalized in-app 79% taking a lifecycle approach to personalization. experiences A lifecycle approach is when Dynamic content 76% marketers personalize content along the entire customer journey Onboarding content 74% — from onboarding to retention and for new customers ongoing support. Marketers Using a Lifecycle Approach To Personalization Still, 43% of marketers take a fragmented approach to personalization — demonstrating an understanding of customer needs at certain stages and leveraging mass messaging at others. 60% The divide is sharper when segmented by 59% 48% All respondents performance, as underperformers fall behind 57% their high- and moderate performing peers. High Moderate Under- performers performers performers
TH SALESFORCE STATE OF MARKETING, 9 EDITION 25 03 High Performers Move Closer to Full Cross- Channel Personalization Marketers Focus More on Their First-Party Channels The battle to win over audiences is only getting harder as customer expectations continue to Extent of Personalization Within The Following Channels rise. Seventy-three percent of customers expect Full personalization Some personalization No personalization better personalization as technology advances.* Mobile messaging 57% 37% 5% Yet, fewer than six in 10 marketers are able to fully personalize familiar channels such as Email marketing 54% 41% 5% email and mobile messaging. A closer look Social media 52% 41% 7% at maturity levels shows a wide gap between performance tiers. Website/app 49% 44% 6% Average number of channels Digital ads 49% 44% 7% with full personalization: - High performers: 6 Video 48% 44% 8% - Moderate performer: 5 Direct mail/ 48% 46% 6% - Underperformers: 3 print advertising Digital content 47% 46% 7% (e.g.,blogs, webinars) While personalization is highest on channels Events and that are easy to test and iterate on the fly like sponsorships 44% 48% 8% mobile and email, it remains a work in progress Audio 43% 50% 7% for channels demanding more production time and planning like audio or TV/OTT. Organic search 42% 47% 11% (not including paid search) TV/OTT 41% 51% 7% Base: Marketers who use the selected channels *Salesforce State of the Connected Customer, August 2023.
TH SALESFORCE RESEARCH STATE OF MARKETING, 9 EDITION 26 04 Impressions Increase by 7.1K Marketers Seek Unified Analytics
TH SALESFORCE STATE OF MARKETING, 9 EDITION 27 04 KPIs Focus on Revenue Marketers are metrics-minded, using data to track value, refine performance, and drive Marketers Keep Close Tabs on Sales Impact sales forward. The three most common marketing KPIs align Ranked Popularity of Marketing Metrics/KPIs with the sales function, showing efforts to 1 Marketing/sales pipeline reduce siloed work, coordinate in the pre-sales process, and present a cohesive, unified front 2 Revenue to customers and prospects. 3 Marketing/sales funnel (Base: B2B marketers) Marketers closely monitor their 4 Web/mobile analytics marketing/sales pipeline (64%) 5 Customer retention rates and funnel (63%). 6 Content engagement Low adoption of KPIs beyond acquisition and 7 Customer acquisition costs topline revenue show there is progress to be made on full attribution. 8 Customer satisfaction metrics 48% of marketers track customer 9 Customer referral rates/volume lifetime value. 10 Customer lifetime value (CLV) This is especially apparent for longer term measurements such as customer lifetime value (CLV) that measure the ROI of nuanced and targeted customer retention strategies.
TH SALESFORCE STATE OF MARKETING, 9 EDITION 28 04 Top Performers Demonstrate Success Through Analytics Marketers Connect the Dots to Revenue Analytics remains the watchword for both performance evaluation and strategic Marketers Who Agree With the Following Statements iteration. More than 80% of marketers feel High performers Moderate performers Underperformers they have a clear sense of their impact on revenue and pipeline. I have access to All 94% But the work isn't done: improving all the customer respondents 88% insights needed for % marketing ROI/attribution remains a campaign planning 85 67% top priority, behind only adopting AI and refining the use of technology. All We have a clear respondents 95% The ability to demonstrate value via sales, view into marketing's % 89% revenue, and pipeline impact is crucial for impact on revenue 88 74% securing the support and budget needed to succeed. This is where high performers shine. We have a All 93% clear view into respondents 89% Nearly all high performers (93%) have a marketing's impact % 71% on sales pipeline 86 clear view into their impact on sales pipeline compared to 71% of underperformers. Unsurprisingly, marketers who can identify Our marketing All 95% their impact and adjust as needed are strategy makes a respondents 91% significant impact % 73% outperforming those who can’t. on sales 88
TH SALESFORCE RESEARCH STATE OF MARKETING, 9 EDITION 29 Enroll into our 05 loyalty program Deeper Relationships Emerge with ABM and Loyalty Programs
TH SALESFORCE STATE OF MARKETING, 9 EDITION 30 05 B2B Marketers Use ABM to Grow Customers at Every Stage Marketers Focus Efforts On Customers Account-based marketing (ABM) requires close collaboration between marketing Percent of B2B Respondents Who Market to the Following Audiences and sales teams to identify and prioritize key accounts. At its core, ABM unleashes a concentrated marketing effort for more 78% targeted results. In fact, B2B marketers 65% 64% allocated an average of 12% of their budgets on ABM programs, emphasizing the value in directing resources toward accounts Accounts Opportunities Leads with the highest potential for conversion. (e.g., deepening relationships (e.g., personalizing for (e.g., nuturing initial with existing customers) serious potential buyers) interest and engagement) However, B2B marketers aren’t just focused on existing customers: Six in 10 use ABM for customer acquisition. Nearly the same number of marketers (65%) are expanding How B2B Marketers Use Account-Based Marketing scope to pursue potential buyers showing an interest in partnering with sales earlier on in the process. 60% 48% 48% 43% 39% Customer Product-led Upselling Cross-selling Adoption acquisition growth
TH SALESFORCE STATE OF MARKETING, 9 EDITION 31 05 Loyalty Data Gets Synced, Loyalty Data is Powerful — If It’s Easy to Access But Functionality Lags Across Touchpoints Extent Loyalty Data Is Integrated Across Departments When customers provide more data, they 1% expect better experiences. It’s a simple 78% trade, but when it comes to loyalty, marketers are falling short. Only 39% say Fully integrated across all functions their customers get full loyalty program Integrated with some functionality across touchpoints. 41% but not all functions Not integrated While internal data integration is relatively 58% Don't know strong, the underlying issue may be connecting all the channels where customers engage. On average, consumers engage with companies across 8 channels.* Extent Customers Can Use Loyalty Program Functionality Across Touchpoints With diverse touchpoints, consolidating and 9% synchronizing data becomes increasingly complex, leading to fragmented experiences 78% instead of seamless access to the benefits that Accessible and usable customers expect. 39% across all touchpoints Accessible and usable across some touchpoints Accessible and usable on one touchpoint 52% *Salesforce State of the Connected Customer, August 2023.
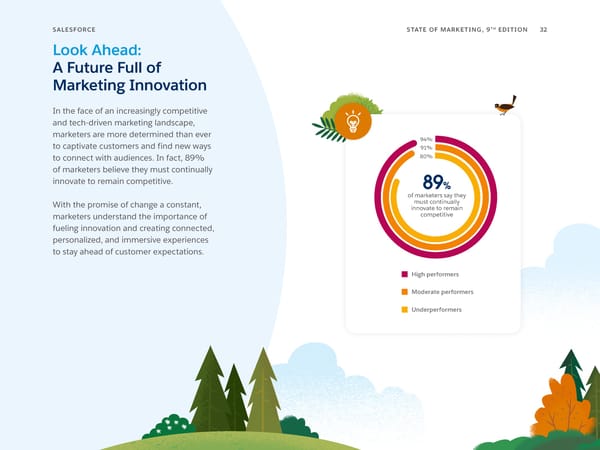
TH SALESFORCE STATE OF MARKETING, 9 EDITION 32 Look Ahead: A Future Full of Marketing Innovation In the face of an increasingly competitive and tech-driven marketing landscape, marketers are more determined than ever 94% to captivate customers and find new ways 91% to connect with audiences. In fact, 89% 80% of marketers believe they must continually innovate to remain competitive. 89% of marketers say they With the promise of change a constant, must continually innovate to remain marketers understand the importance of competitive fueling innovation and creating connected, personalized, and immersive experiences to stay ahead of customer expectations. High performers Moderate performers Underperformers
TH SALESFORCE RESEARCH STATE OF MARKETING, 9 EDITION 33 Survey Demographics
TH SALESFORCE STATE OF MARKETING, 9 EDITION 34 Survey Demographics Country Spain ......................................................3% Technology ............................................3% Argentina ...............................................3% Sweden ..................................................1% Travel and/or transportation ...............5% Australia .................................................4% Switzerland ............................................2% Other .....................................................1% Belgium .................................................2% United Arab Emirates ...........................2% Brazil ......................................................5% United Kingdom ...................................5% Business Model Canada ..................................................5% United States ..................................... 10% B2B ...................................................... 25% Chile .......................................................2% Industry B2C ...................................................... 50% Colombia ...............................................2% B2B2C ................................................. 25% Denmark ..............................................
TH SALESFORCE RESEARCH STATE OF MARKETING, 9 EDITION 35 Appendix
TH SALESFORCE STATE OF MARKETING, 9 EDITION 36 Marketing Data Sources Used By Maturity Level High performers Moderate performers Underperformers First party data Offline identities All 87% (e.g., postal address, phone number, age, gender) respondents All 71% % 86% respondents 75% 70% 84 % 69 66% Transactional data (e.g., purchase history) Offline identities All 88% (e.g., postal address, phone number, age, gender) respondents 85% All 71% % respondents 70% 84 74% % 68 59% Customer insight data Third-party data (e.g., propensity to buy/churn, product interests...) (i.e., devices and cookies from an aggregator or All 89% databroker such as Acxiom, Nielsen, or Neustar) respondents 86% All 67% % respondents 61% 84 74% % 61 50% Known digital identities (e.g., email address, social IDs) Non-transactional data All 81% (e.g., customer service interactions, lead-scoring data) respondents 80% All 41% % respondents 43% 78 73% % 44 50% Second-party data (i.e., devices and cookies from a direct relationship with another marketer or publisher) All 75% respondents 71% 70% 60%
TH SALESFORCE STATE OF MARKETING, 9 EDITION 37 Marketers' Generative AI Concerns By Seniority Chief Marketing Officer Vice President, SVP, EVP, or equivalent Team leader, supervisor, manager, director, or equivalent Data exposure or leakage Lack of strategy or use cases Difficulty learning how All 41% All 30% to use the technology respondents 29% respondents 26% All 25% % % respondents 24% 32 32% 27 27% % 23 23% Copyright or intellectual property concerns Distrust in generative AI Adherence to All 27% All 26% brand guidelines respondents 25% respondents 27% All 21% % % respondents 24% 27 28% 25 25% % 23 23% Fear that AI will Lack of necessary data replace my job All 29% All 20% Environmental impacts respondents 28% respondents 23% All 23% % % respondents 25% 27 27% 24 25% % 22 20% Inaccurate outputs Biased outputs All 29% All 24% respondents 27% respondents 22% % 27% % 24% 27 24
TH SALESFORCE STATE OF MARKETING, 9 EDITION 38 Want More? Marketing Cloud Overview Salesforce Data Cloud See how top brands activate data and AI with Centralizing data is just the first step, but it’s not enough. Salesforce to grow customer relationships. Learn what marketers can do with Data Cloud. Learn more Learn more Salesforce+ Get inspired with free access to award-winning content for business professionals. Learn more
The information provided in this report is strictly for the convenience of our customers and is for general informational purposes only. Publication by Salesforce does not constitute an endorsement. Salesforce does not warrant the accuracy or completeness of any information, text, graphics, links, or other items contained within this guide. Salesforce does not guarantee you will achieve any specific results if you follow any advice in the report. It may be advisable for you to consult with a professional such as a lawyer, accountant, architect, business advisor, or professional engineer to get specific advice that applies to your specific situation. © Copyright 2024, Salesforce, Inc. All rights reserved.


