
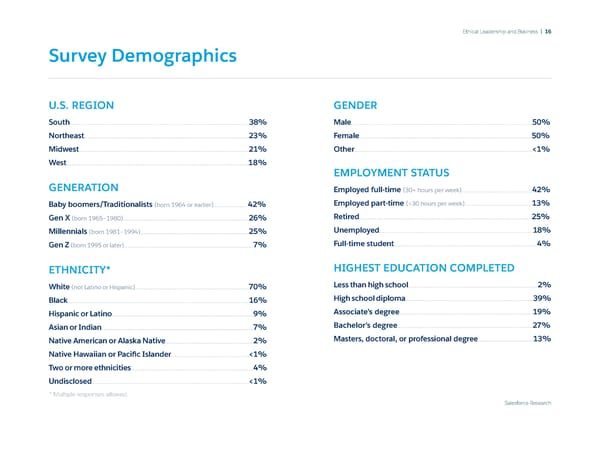
Ethical Leadership and Business | 16 Survey Demographics U.S. REGION GENDER South........................................................................................................38% Male.........................................................................................................50% Northeast...............................................................................................23% Female....................................................................................................50% Midwest..................................................................................................21% Other.......................................................................................................<1% West.........................................................................................................18% EMPLOYMENT STATUS GENERATION Employed full-time (30+ hours per week).........................................42% Baby boomers/Traditionalists (born 1964 or earlier)................... 42% Employed part-time (<30 hours per week).......................................13% Gen X (born 1965–1980).........................................................................26% Retired....................................................................................................25% Millennials (born 1981–1994)...............................................................25% Unemployed.........................................................................................18% Gen Z (born 1995 or later)...........................................................................7% Full-time student...................................................................................4% ETHNICITY* HIGHEST EDUCATION COMPLETED White (not Latino or Hispanic)..................................................................70% Less than high school...........................................................................2% Black..........................................................................................................16% High school diploma..........................................................................39% Hispanic or Latino..................................................................................9% Associate’s degree...............................................................................19% Asian or Indian........................................................................................7% Bachelor’s degree................................................................................27% Native American or Alaska Native...................................................2% Masters, doctoral, or professional degree................................13% Native Hawaiian or Pacific Islander.............................................<1% Two or more ethnicities.......................................................................4% Undisclosed...........................................................................................<1% * Multiple responses allowed. Salesforce Research
 Ethical Leadership and Business Page 16 Page 18